2020 Research Found Increased CRW Populations in Illinois

Written by Crystal Dau and Mary Gumz
Something went wrong. Please try again later...

Objectives

In 2020, Pioneer undertook research to:

  • Quantify western and northern corn rootworm beetle populations across Northern Illinois with Pherocon® AM/NB sticky traps.
  • Compare the CRW trap quantities and geographic ranges in 2020 to results from 2019.
  • Understand how modern management practices influence corn rootworm population levels.
  • Identify best management practices for growers to make informed decisions for the following growing seasons.

The study revealed that CRW populations increased in Northern Illinois and shed light on management options based on population.

Study Description

  • Year:  2020
  • Locations:   173 field locations across northern Illinois
  • Sampling Methods:
    • Sticky traps placed in fields starting at blister stage (R2)
    • Sticky traps placed per field: 6
    • Northern and western corn rootworm beetles were counted every seven days and average counts per trap were recorded.
    • Trapping continued for 5 consecutive weeks by Pioneer Sales Professionals and Pioneer Agronomists.
    • Trapping was conducted in fields managed in the following rotations:
      • Continuous corn fields
      • Two years back-to-back corn in past three years
      • At least one year soybeans between corn crops
  • Foliar Insecticide Treatment:
    • 44 locations included a foliar insecticide treatment.
    • Treatments were made with an aerial fungicide applicator and were made at blister stage (R2).
    • Proper safety and reentry interval protocol was followed by individuals collecting beetle counts.

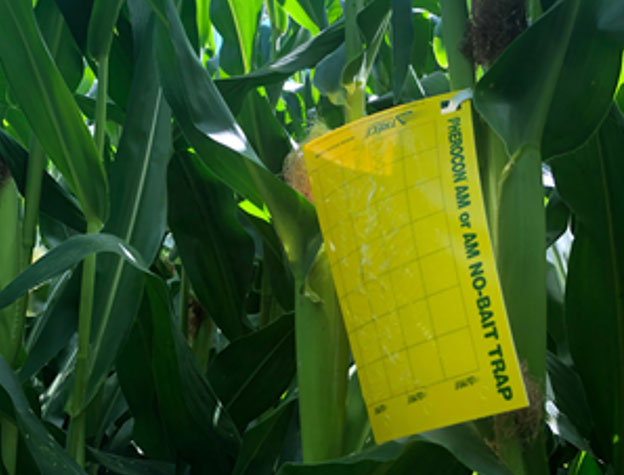
Photo - sticky trap set in field

Figure 1. A new Pherocon® AM/NB sticky trap set in a corn field near Mount Morris, Illinois. Trapping extended for 5 consecutive weeks, with traps replaced and beetles counted every week.

Results: Crop Rotation Matters

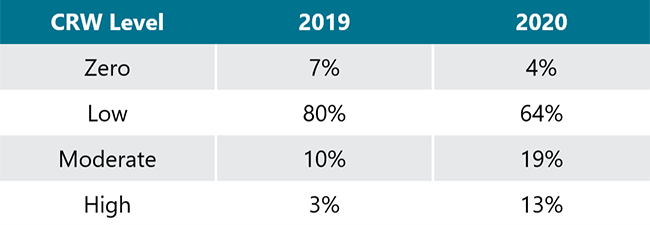
  • Corn rootworm populations were characterized at four different levels for each sampling location. The percentage of locations at each level is summarized in Table 1.
    • Zero = no beetles collected
    • Low = <21 beetles/week
    • Moderate = traps averaged 21-50 beetles/week
    • High = traps averaged >50 beetles/week

Table 1. Corn rootworm population levels by year.

Table - Corn rootworm population levels by year.

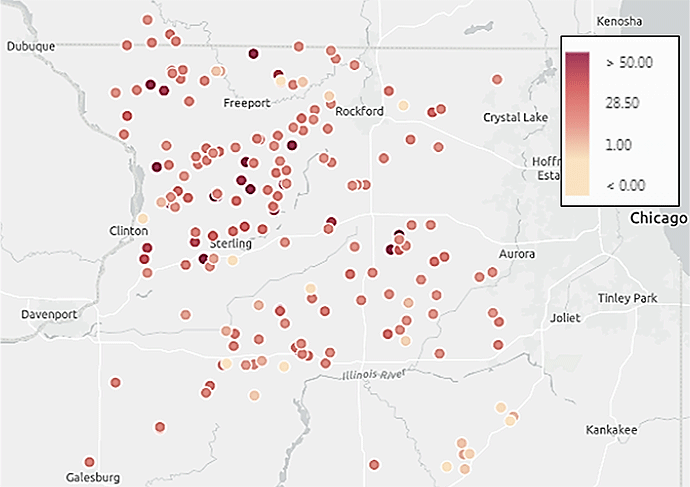
Map - CRW populations observed at regional trapping locations.

Figure 2. Average CRW population levels (beetles/trap/week) observed at corn rootworm beetle trapping locations in 2020.

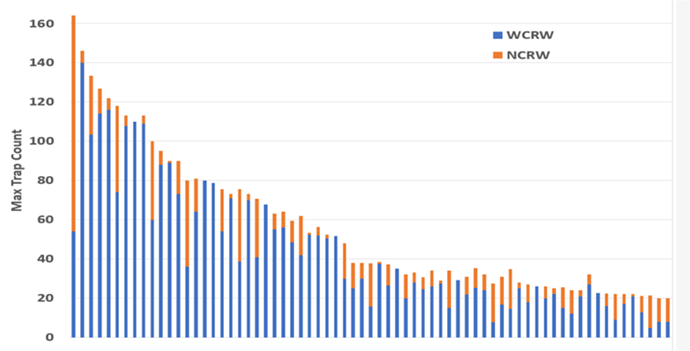
  • Western corn rootworm and northern corn rootworm species compositions varied at locations depending on population levels (Figure 3).
    • High population locations largely consisted of western corn rootworms at an average of 78 percent.
    • Moderate population locations had a slightly more even mix of species, with western corn rootworm averaging 59 percent and northern corn rootworm averaging 41 percent.

    Chart - CRW species compositions for high and moderate population locations - northern Illinois.

    Figure 3. Species compositions for high and moderate population locations across northern Illinois in 2020.

  • Planting date had less influence on the timing of peak trap counts in 2020 than it did in 2019, when planting dates were spread out over a much longer window (Table 2).
    • Most locations had peak CRW counts during the third week of counting (usually around August 3).
    • Locations with extremely high counts (100+ beetles) early returned to more moderate counts later in the study.
    • Sites that started with low counts did not spike to higher counts later.

    Table 2. Corn rootworm population levels by year.

    Table - Corn rootworm population levels by year.

  • Crop rotation affected CRW pressure levels (Table 3).
    • Fields of continuous corn or with two years back-to-back corn in past three years were more likely to have high or moderate trap counts.
    • Fields with at least one year of soybeans in between corn crops in the past three years had lower trap counts than the sites with two or more years of corn back-to-back. However, rotated sites with soybeans had more low pressure sites compared to 2019, when most rotated sites had no CRW pressure.

    Table 3. Distribution of pressure levels based on crop rotation.

    Table - Distribution of CRW pressure levels based on crop rotation.

Comparison to 2019: Increased CRW Pressure

  • Ratios of western and northern CRW beetles were similar to those observed last year in northern Illinois. Similar studies conducted in 2020 in Eastern Illinois and Indiana found that populations were composed primarily of western CRW.
  • However, overall results showed increased total CRW populations and increased pressure in all geographies.
    To maintain efficacy of Bt corn rootworm products, it is essential to develop a rootworm management plan that breaks the cycle, manages populations and protects the Bt trait.
  • Effects of planting date and crop rotation on CRW populations were similar to those observed in 2019.

Control Options Based on Your CRW Population

  • If traps average <21 beetles per week:
    • Low rootworm populations are anticipated next year
      • Rotate acres to another crop
      • Plant a corn rootworm Bt corn product
      • Plant a non-Bt rootworm product with Poncho® 1250/VOTiVO® insecticide treatment OR a soil insecticide for larvae
  • If traps average 21-50 beetles per week:
    • Moderate rootworm populations are anticipated next year
      • Rotate acres to another crop
      • Plant a corn rootworm Bt corn product
      • Apply a soil insecticide at planting for larvae
  • If traps average >50 beetles per week:
    • High rootworm populations are anticipated next year
      • Rotate acres to another crop
      • Apply foliar insecticide in the current year to control adult beetles prior to egg-laying and use a corn rootworm Bt corn product or soil-applied insecticide the following year

Management Considerations

  • Studies have shown that Qrome® products are an effective tool for corn rootworm management.
  • Pioneer and university research suggests that continuous, uninterrupted use of the same corn rootworm Bt technology can lead to reduced product efficacy against these insects.
  • To maintain efficacy of Bt corn rootworm products, it is essential to develop a rootworm management plan that:
    • Breaks the cycle
    • Manages populations
    • Protects the Bt trait
  • Please contact your Pioneer Sales Professional for more information.


Logo - Qrome Products - for continuous corn page

Manage Corn Rootworm

Plant our most optimized balance of insect protection and agronomic performance on your acres. Pioneer® brand Qrome® corn products offer two modes of action to defend against corn rootworm.

Learn More


Qrome logo  AcreMax XTreme logo  Herculex Xtra logo  YieldGard Corn Borer logo  LibertyLink logo  Agrisure RW logo

Qrome® products are approved for cultivation in the U.S. and Canada. They have also received approval in a number of importing countries, most recently China. For additional information about the status of regulatory authorizations, visit http://www.biotradestatus.com. Agrisure® is a registered trademark of, and used under license from, a Syngenta Group Company. Agrisure® technology incorporated into these seeds is commercialized under a license from Syngenta Crop Protection AG. YieldGard®, the YieldGard Corn Borer design and Roundup Ready® are registered trademarks used under license from Monsanto Company. Liberty®, LibertyLink® and the Water Droplet Design are trademarks of BASF. Herculex® insect protection technology by Dow AgroSciences and Pioneer Hi-Bred. Poncho® and VOTiVO® are registered trademarks of BASF.

Poncho® and VOTiVO® are registered trademarks of BASF.

The foregoing is provided for informational use only. Please contact your Pioneer sales professional for information and suggestions specific to your operation. 2020 data are based on average of all comparisons made in 173 locations through October 20, 2020. Multi-year and multi-location is a better predictor of future performance. Do not use these or any other data from a limited number of trials as a significant factor in product selection. Product responses are variable and subject to a variety of environmental, disease, and pest pressures.  Individual results may vary.