Heat Stress Effects on Corn
Written by Mark Jeschke, Ph.D., Agronomy Manager
Written by Mark Jeschke, Ph.D., Agronomy Manager
Heat stress is defined as the rise in temperature beyond a threshold level for a period of time sufficient to cause irreversible damage to plant growth and development (Wahid et al., 2007). It is generally understood among corn growers that excessive heat can be detrimental to yield, but how hot is too hot, and what is the risk of yield losses due to excessive heat now and in the future?
Multiple statistical studies have shown negative correlations between average seasonal temperature and corn yield (Lobell and Field, 2007; Sakurai et al., 2011; Tao et al., 2008). As average temperatures increase above a certain point, corn yields decrease. Further analysis of yield and weather data has found that the main driver of this negative association is the sensitivity of corn to temperatures above 86 °F (30 °C) (Schlenker and Roberts, 2009). Researchers have begun using the terms extreme degree days (EDD) or extreme heat degree days (HDD) to quantify the accumulation temperatures above this level (Lobell et al., 2013; Roberts et al., 2013). Corn yields tend to increase with temperature up to this threshold and then drop off sharply when temperatures exceed it.
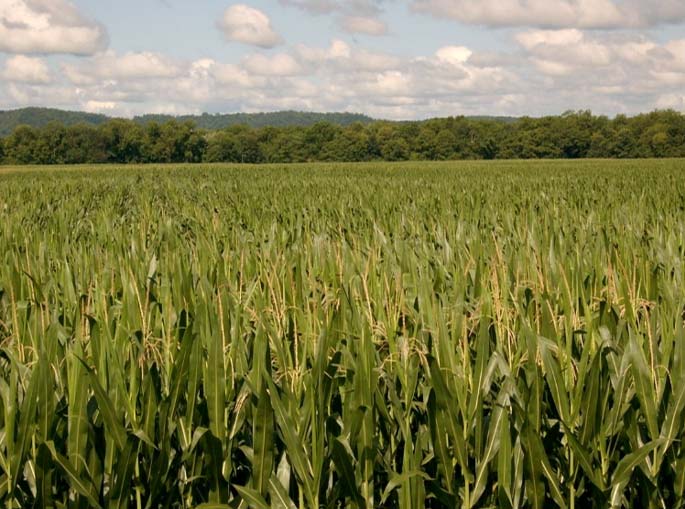
Concerns regarding the direct effects of extreme heat on corn have often focused on reproductive success; specifically, the potential for high heat to desiccate silks and reduce pollen viability, negatively affecting pollination. However, in corn production areas of North America, it is relatively rare for temperatures to reach the threshold necessary to impact pollination. And yet, studies have shown that high temperatures are having a negative impact on corn yields. This suggests other heat stress mechanisms are involved.
Increasing global temperatures mean that corn crops will likely experience more frequent heat stress in many areas, making it important to understand how high heat affects corn growth and yield.
Heat stress effects on corn are complex and often difficult to quantify. Heat stress is not just a function of temperature, but also depends on the duration and timing of high temperature, as well as the rate of temperature change (Wahid et al., 2007). Some forms of heat stress can create visual injury symptoms while other are more subtle.
Heat stress is also often accompanied by drought, which can make it challenging to disentangle the individual impacts of temperature and water stress on corn growth and yield. Research has shown that the direct effect of heat stress is important, but the greater impact likely comes from the effect of heat on intensifying water stress.
When examining the effects of temperature on corn yield, it is useful to consider the predominant conditions to which corn was adapted in its area of origin. The genetic lineage of corn can be traced back the Central Highlands of Mexico (Galinat, 1988), specifically the Tehuacán Valley and Balsas River Valley. Summer climate in this region is characterized by relatively mild daytime high temperatures, cool nights, and abundant sunshine. Average summer temperatures in much of the Corn Belt are commonly warmer during the day and much warmer during the night than those to which corn was originally adapted in its native region (Figure 1).
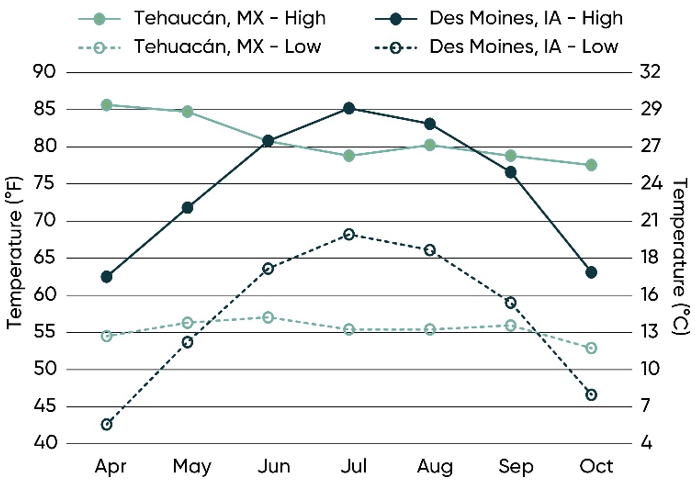
Figure 1. Average daily high and low temperatures for Tehuacán, Puebla, in the Central Highlands of Mexico near where corn was first cultivated, and for Des Moines, IA, in the heart of the modern U.S. Corn Belt.
Corn yield reduction from heat stress can be associated with reductions in both source and sink capacity. Impact on yield depends on the growth stage of the corn at the time stress occurs. The most critical period for corn yield determination is the roughly 4- to 5-week window bracketing silking when kernel number is set. Approximately 85% of total grain yield is related to the total number of kernels produced per acre (Otegui et al., 1995). Any stress during this time that reduces the number of kernels a plant is able to set will negatively impact yield. Even if the stress is temporary and the plant recovers, the damage to yield will be done.
Heat stress during this timeframe can reduce yield in a couple of ways: by inhibiting successful pollination and by reducing net photosynthesis, which can lead to an increase in kernel abortion. Both mechanisms can reduce the number of kernels on the ear. Heat stress can continue to impact yield through grain fill by reducing kernel weight, much like any other form of stress that inhibits photosynthetic carbon assimilation. Stalk quality can also be impacted if the stress forces the plant to increase its reliance on remobilized carbohydrates to complete grain fill.
Temperatures above 90 °F (32 °C) have the potential to negatively impact pollination. Prolonged exposure to temperatures above 90 °F (32 °C) has been shown to dramatically reduce pollen germination (Herrero and Johnson, 1980). Temperatures above 95 °F (35 °C) depresses pollen production and can desiccate exposed silks, especially when accompanied by low relative humidity (Hoegemeyer, 2011). High temperatures and low humidity can similarly desiccate pollen grains once they are released from the anthers. Temperatures over 100 °F (38 °C) can kill pollen (Nielsen, 2020).

Corn tassel branches showing anthers extruded.
Peak pollen shed usually occurs in mid-morning. A second period of pollen can occur in late afternoon or evening as temperatures cool.
Under cool, cloudy conditions, pollen shed may continue throughout most of the day.
However, research suggests that yield loss due to heat stress effects on pollination is relatively rare in North America (Lobell et al., 2013). Daily maximum temperatures in the Corn Belt commonly reach the mid or upper 90s but pollination is usually not severely affected. Pollen shed typically occurs during early to mid-morning hours before temperatures climb to potentially harmful levels. The daily high temperature would likely need to reach well above 100 °F for temperatures to reach dangerous levels during mid-morning when most pollen shed occurs. For example, July 25, 2012 was the hottest day of a notoriously hot summer in central Iowa. Maximum temperature in Des Moines hit 106 °F (41 °C) at 5:00 pm, but temperatures between 9:00 and 10:00 am were only 90-95 °F (30-35 °C), just barely reaching the threshold for pollen and silk desiccation (Figure 2). Furthermore, pollination occurs over a period of several days, providing multiple opportunities for viable pollen to reach exposed silks.
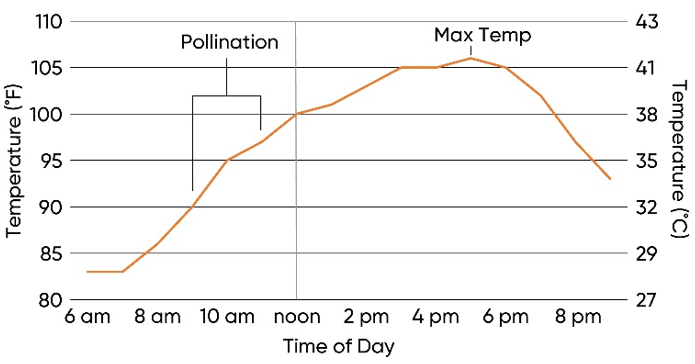
Figure 2. Temperature over the course of the day on July 25, 2012 showing timing of peak pollination and maximum daily temperature.
Temperature effects on crop physiology are often characterized based on ambient air temperature; however, the temperature that photosynthesizing cells inside corn leaves actually experience can differ somewhat from that of the surrounding air. Leaves often have a lower temperature than the air around them because the evaporation of water transpired through the leaves cools them. The drier the air, the cooler the leaf of a well-watered plant will be compared to the surrounding air.
This cooling effect is illustrated by comparing the surface temperatures of living leaf tissue vs. dead leaf tissue shown in Figure 3. The temperatures of a live and dead leaf adjacent to each other in the upper canopy of a corn field differed by more than 7 °F. The temperature of the living leaf was 94.4 °F (34 °C), a few degrees above the ambient air temperature of 91 °F (33 °C), while the dead leaf was well-above ambient temperature at 102 °F (39 °C).
Temperature can also vary depending on the level of sun exposure and the position of the leaf relative to the angle of the incoming sunlight. Figure 4 shows a partially shaded leaf in the corn canopy, with the shading from other leaves creating a banded appearance in the infrared imagery. The temperature of a shaded portion of the leaf was 87.3 °F (31 °C), a few degrees below air temperature, while a portion of the leaf a few inches away exposed to direct sunlight was over 7 °F hotter. Shaded and exposed areas will shift over the course of the day, so a given spot on a leaf may experience a range of different temperatures even if the surrounding air temperature is relatively constant.
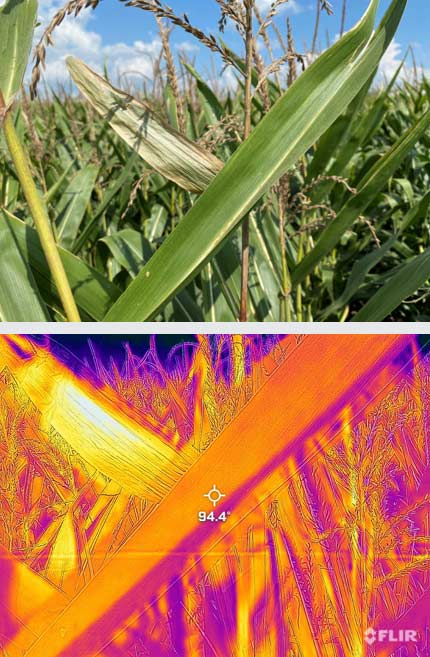
Figure 3. A live leaf and a dead leaf in the upper canopy. The surface temperature of the live leaf is 94 °F (34 °C), while the temperature of the dead leaf is 102 °F (39 °C).
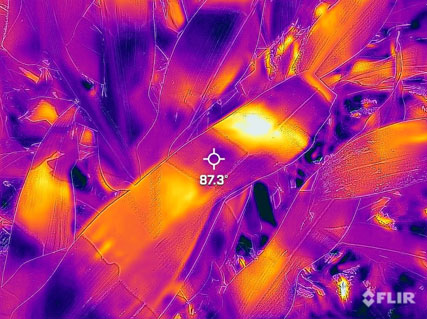
Figure 4. Leaf temperature differences due to partial shading in the canopy. A shaded portion of the leaf is 87 °F (31 °C), while a sunlit portion only a few inches away is nearly 95 °F (35 °C).
Heat stress can also impact corn yield through reduced net photosynthesis. Decreased net photosynthesis can cause large reductions in yield if it occurs during the critical period for kernel number determination. When stress occurs during this interval, the corn plant typically starts to abort kernels at thetip of the ear and moves toward the base of the ear until it reaches a point that the remaining viable kernels can be sustained by the plant.
Temperature dependent biological reactions, such as photosynthesis and respiration, generally have an optimum temperature (Topt) for operation (Figure 5). Photosynthesis and respiration are slow at cooler temperatures, increase as the temperature increases, and decline and eventually cease when the temperature gets too high. The optimum temperature for respiration is greater than that for photosynthesis. Net photosynthesis is a measure of carbon assimilated through photosynthesis (sugar produced) minus carbon expended through respiration (sugar consumed). Net photosynthesis has a Topt lower than that of gross photosynthesis due to the offsetting effect of the higher respiration rate (Figure 5).
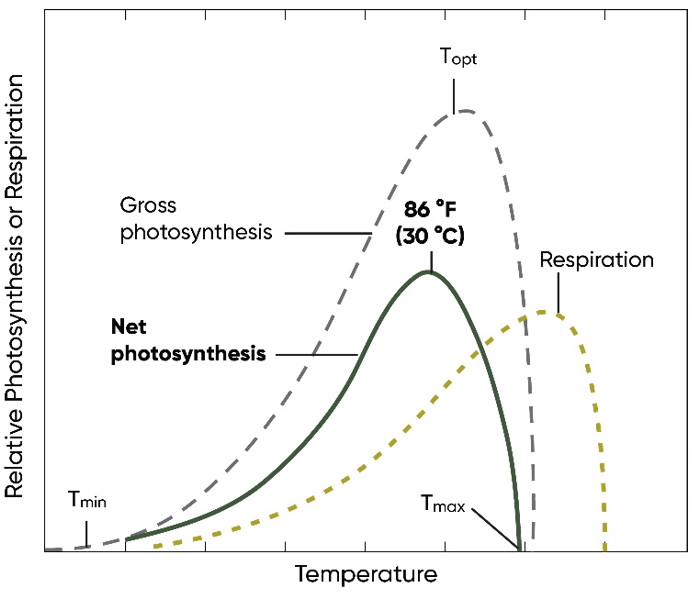
Figure 5. Generalized model of temperature effects on rates of gross photosynthesis, respiration, and net photosynthesis. Net photosynthesis in corn is optimized at 86 °F. (Figure adapted from Hopkins, 1999).
Plant species with the C4 photosynthetic pathway such as corn generally have a higher optimum temperature for photosynthesis than C3 plants. In C3 plants, net photosynthesis is reduced at higher temperatures due to an increase in photorespiration caused by higher oxygenase activity of ribulose-1,5-bisphosphate carboxylase-oxygenase, (rubisco), an enzyme involved in the first major step of photosynthetic carbon fixation. As temperature increases, the ratio of dissolved O2/CO2 and the specificity of rubisco for O2 increase, favoring oxygenase activity. C4 plants possess a mechanism to eliminate this inefficiency by locally increasing the concentration of CO2 available to rubisco enzymes and, as such, are not constrained by temperature in the same way.
Reduced net photosynthesis in corn under heat stress has also been shown to be associated with rubisco activity, but it is due to the inactivation of the enzyme at high temperatures. A daytime temperature of 86 °F (30 °C) is ideal for corn growth (Miedema et al., 1987). At temperatures above this level, net photosynthesis declines due to the loss of rubisco activation (Crafts-Brandner and Salvucci, 2002).
The degree to which net photosynthesis is reduced at high temperatures can depend on how quickly temperature increases. The faster the increase, the greater the reduction in photosynthesis. Crafts-Brandner and Salvucci (2002) found that a rapid increase to 113 °F (45 °C) reduced net photosynthesis by 95%, but a gradual increase to the same level reduced it by only 50%.
The level of solar radiation has also been shown to play a role in heat stress effects on corn by influencing the optimum temperature for net photosynthesis. Under light-limited conditions, the optimum temperature shifts lower due to the fact that respiration continues to increase with higher temperatures, whereas gross photosynthesis does not increase due to light limitation (Rainguez, 1979).
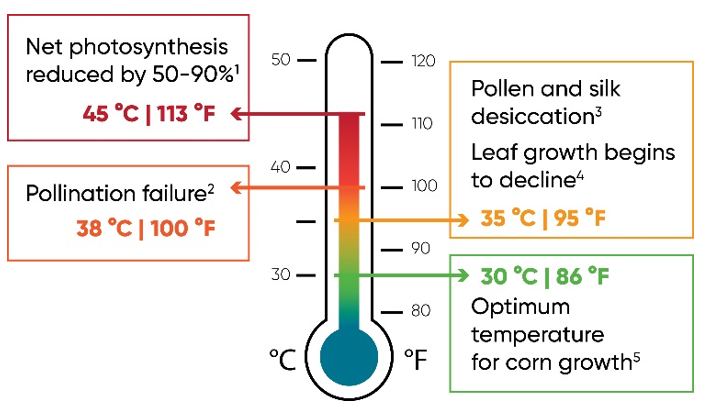
Figure 6. Key temperature thresholds for heat stress effects on corn pollination and growth.
1Crafts-Brandner and Salvucci (2002), 2Nielsen (2020), 3Hoegemeyer (2011), 4Waqas et al. (2021), 5Miedema et al. (1987).
High temperatures can impact corn yield directly, by reducing pollination and net photosynthesis, but field research and crop modeling studies indicate that a greater impact likely comes through the interaction of heat and water stress. Higher temperatures create a higher vapor pressure deficit (VPD) between the saturated leaf interior and the ambient air. This causes the transpiration rate of plants to increase, placing a greater demand on soil water supply and potentially accelerating the onset of drought stress.
Vapor pressure deficit (VPD) is the difference between how much water the air can hold when it is saturated and how much water it currently holds. It combines relative humidity (RH) and temperature into a single variable to describe the evaporative potential of the atmosphere. Air space in the interior of living plant tissue is essentially fully saturated with water (100% RH). Water vapor will tend to move from an area of higher concentration to an area of lower concentration, so if the ambient air is less than 100% humidity, it will pull water out of plant leaves, driving transpiration of water through the plant.
The greater the vapor pressure deficit between the leaf interior and the surrounding air, the faster the rate at which water will be pulled out of the plant and evaporated. Temperature is important to this equation because VPD increases exponentially with increasing temperature, even if RH stays constant. For example, if the RH of ambient air is 30%, the vapor pressure deficit will be much greater at 100 °F (38 °C) than at 77 °F (25 °C) (Figure 7), creating a much higher evaporative demand at the higher temperature.
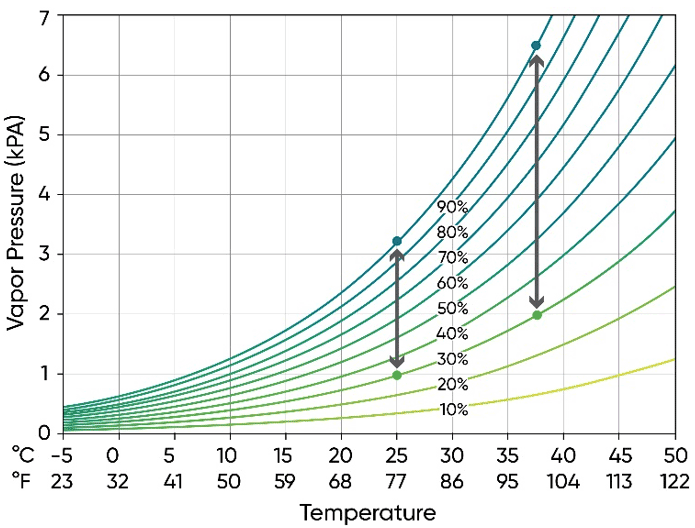
Figure 7. Vapor pressure for water by relative humidity and temperature.
Heat and water stress can result in visible injury to corn in the form of sunscald. This occurs when the increase in evaporative demand exceeds the plant’s ability to respond. The plant is unable to transpire water rapidly enough to cool heat-stressed leaf tissue, causing leaf tissue to die. Younger leaves and leaves with direct orientation to the sun are typically most affected.
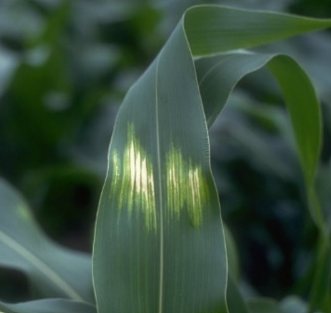
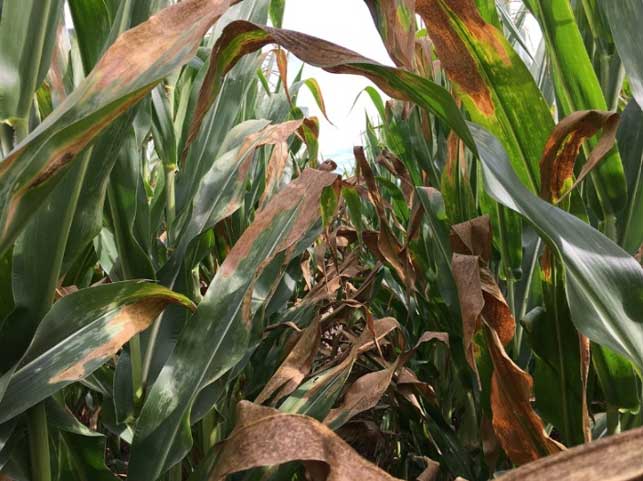
Corn canopy with severe sunscald injury.
Corn plants respond to higher VPD by closing their stomata, which helps preserve water for periods when evaporative demand is lower. However, reduced stomatal conductance also reduces the rate at which plants are able to take in CO2, which lowers the rate of photosynthetic carbon fixation during high-VPD portions of the day.
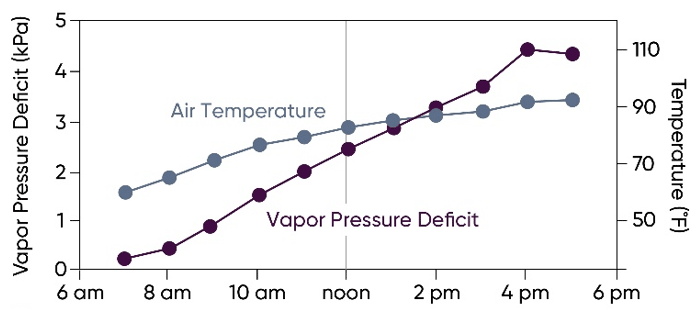
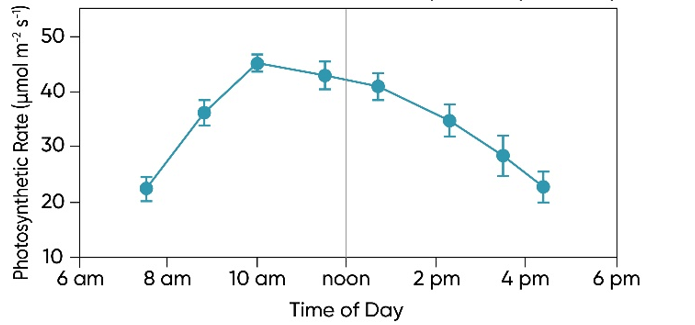
Figure 8. Air temperature, atmospheric vapor pressure deficit, and leaf photosynthetic rate in irrigated corn over the course of a day (Hirasawa and Hsiao, 1999).
Field experiments conducted in an environment in which temperatures reached daily highs in the mid-90s showed reduced photosynthesis and growth of corn associated with high VPD (Hirasawa and Hsiao, 1999). On days with high atmospheric VPD, photosynthetic rate and stomatal conductance peaked during late-morning and then declined throughout the afternoon as temperature and VPD continued to climb (Figure 8). Even in irrigated plots where soil water was ample, this afternoon depression in photosynthetic rate was apparent, although decline was much greater in non-irrigated plots (Figure 9).
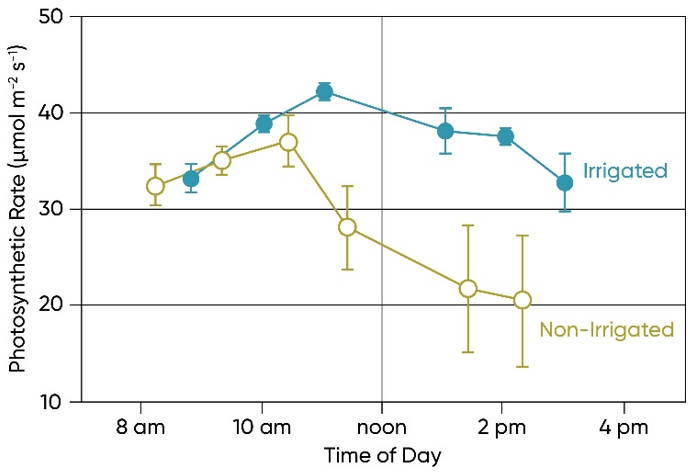
Figure 9. Leaf photosynthetic rate by time of day for irrigated and non-irrigated corn (Hirasawa and Hsiao, 1999).
A recent analysis showed a strong correlation between VPD and EDD accumulation in rainfed corn production in the U.S. Corn Belt (Roberts et al., 2013). Extreme heat contributes to water stress in two ways: by increasing demand for soil water to sustain carbon assimilation, and by depleting water from the soil, thus reducing future water supply. The increased water demand under extreme heat is substantial – raising temperature from 80 °F to 95 °F (27 °C to 35 °C) causes water demand to double (Lobell et al., 2013). Research indicates that the damage caused by extreme heat can be partially mitigated by increased precipitation, but not completely eliminated (Roberts et al., 2013).
Lobell et al. (2013) compared the water stress effect caused by a 20% reduction in precipitation over month-long period with that caused by a 2 °C increase in temperature over the same time period and found that increased temperature had a greater impact on water stress than reduced precipitation. Total seasonal rainfall was found to have a relatively weak relationship with corn yield, indicating that water demand can matter as much or more than water supply.
Wind can exacerbate heat stress by increasing the VPD between the leaves and the air immediately surrounding them. When water is evaporated from plant leaves, the air above the surface gradually becomes more saturated with water vapor. If winds are low, this layer of saturated air stays in place around the crop canopy, causing the evapotranspiration rate to decrease. When winds are high, this layer of saturated air is constantly being removed and replaced with drier air (Allen et al., 1998).
The higher the relative humidity, the less wind speed will matter, as the wind will only be able to replace the saturated air with slightly less saturated air. Under arid conditions though, small variations in wind speed may result in larger variations in VPD and evapotranspiration rate.
The impact of wind can be seen in the “field edge effect” in corn, where corn burns up and yields less along an edge of the field exposed to wind, commonly on the western or southern side (Figure 10). This phenomenon is commonly observed in hot and dry summers. The more severe stress along the field edge is likely due to the fact that the air is driest when it encounters the leading edge of field and picks up moisture as it moves across the crop canopy (White and Licht, 2020; Westgate and Vittetoe, 2017). Consequently, the effect of wind on VPD is greatest for plants near the field edge and lower for plants in the rest of the field.
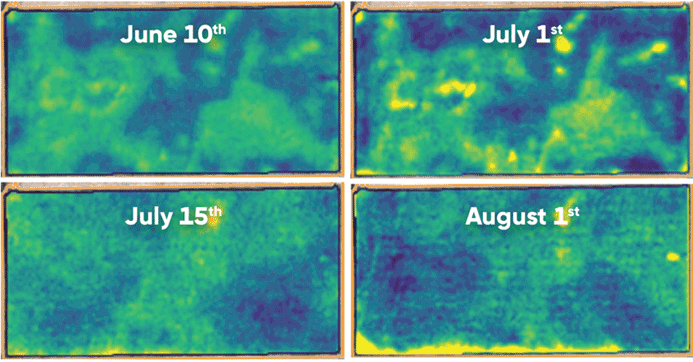

Figure 10. Sequence of Vegetation Index maps showing progression of crop damage along the southern edge of a corn field from June 10 to September 1, 2017.
Research has shown that extreme heat can and does negatively affect corn yield, and that the greater impact likely comes through intensification of water stress rather than the direct effect of heat itself. Yields of rainfed corn show a clear negative response to the accumulation of temperatures above 86 °F (30 °C). An increase in the number of days during the growing season that surpass this threshold could constrain future gains in corn productivity.
Outside of North America, nearly every major crop production area of the world is already experiencing a greater frequency of extreme heat during the growing season, with global corn yields estimated to be 3.8% lower than they would be without recent warming trends (Lobell et al., 2011). Corn-producing areas of the U.S. and Canada have been relatively unaffected so far, as summer temperatures have not increased to the degree that they have elsewhere (Angel et al., 2018). This anomaly has even been given a name – the U.S. “warming hole” – because of the distinct lack of summer warming compared to most of the rest of the world (Partridge et al., 2018). Annual average temperatures in this area have increased, but mostly due to warmer winters and higher night temperatures. Extreme summer heat has stayed steady or declined in much of this area.
This reprieve from rising summer temperatures is not expected to last indefinitely, however. Summer temperatures are projected to increase more in the Midwest than any other region of the United States by mid-century (Vose et al., 2017). Extreme heat is therefore likely to become a more frequent and more severe constraint on corn yields in North America, much as it already is in most other crop-producing regions.
The foregoing is provided for informational use only. Please contact your Pioneer sales professional for information and suggestions specific to your operation. Product performance is variable and depends on many factors such as moisture and heat stress, soil type, management practices and environmental stress as well as disease and pest pressures. Individual results may vary. Pioneer® brand products are provided subject to the terms and conditions of purchase which are part of the labeling and purchase documents.