Community Data vs. Trial Data for Corn Seeding Rate Decisions

Something went wrong. Please try again later...

Written by Mark Jeschke, Ph.D., Pioneer Agronomy Manager
 

Leveraging Community Data

  • The rapid expansion of on-farm data collection capabilities and connectivity has created opportunities to leverage large aggregated sets of data for insights on agronomic practices.
  • Multiple farmer network services are now available that allow individual growers to view summaries of aggregated agronomic data from other growers in the network.
  • Promoted benefits of these services include independence from other input providers, a high volume of aggregated data, and relevance to real-world growing conditions.
  • However, there are some important limitations to the insights that can be gleaned from community data sets that are important to understand when making decisions on management practices such as corn seeding rates.

Limitations of Community Data

Unbalanced Data

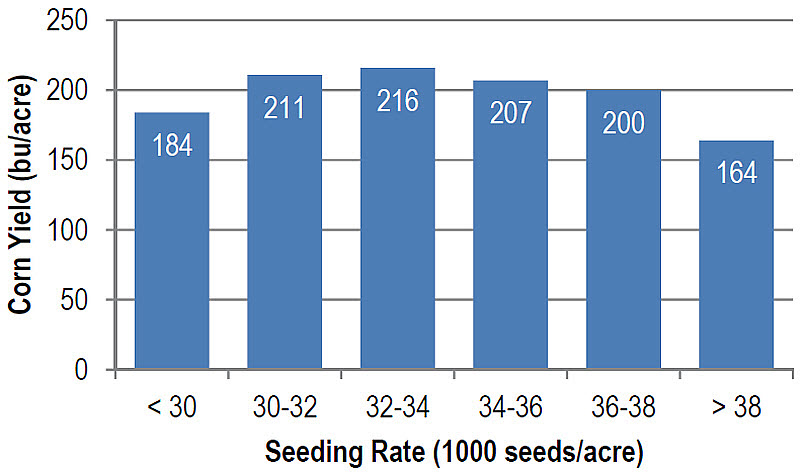
  • Since the dataset is composed of grower data, it only reflects practices used in grower fields. Consequently, seeding rates in a relatively narrow range likely comprise the bulk of the data, while high and low seeding rates may only represent a few fields.
  • If the example in Figure 1 represented a total of 10,000 acres, the middle ranges would likely include over 3,000 acres, while the highest and lowest seeding rate ranges would likely represent less than 500 acres.*

    *Proportions estimated based seeding rate distribution in aggregated 2014 Pioneer as-planted data from Illinois, Indiana, and Missouri, representing over 388,000 acres.

 An example of seeding rate data output for an individual hybrid from a farmer network service.

Figure 1. An example of seeding rate data output for an individual hybrid from a farmer network service.

Non-orthogonality

  • Data for one seeding rate likely come from an entirely different set of fields or environments than data for another rate, therefore seeding rate is correlated with location.
  • This means that no meaningful comparisons between seeding rates are possible because two seeding rates would be comprised of two entirely different sets of fields.
  • Data for very low seeding rates likely represent fields that were lower-yielding to begin with; a low seeding rate would have been selected specifically for this reason. Conversely, data for higher seeding rates would tend to come from higher yield environments.

No Data for New Hybrids

  • Since aggregated community data sets rely on grower data from previous seasons, any hybrid that was not planted at significant volumes the previous season would not be represented in the dataset.

Corn Seeding Rate Decisions

What aggregated community data CAN tell you:

  • Community data provide a summary of seeding rate practices employed by other growers and yields achieved.
    • This allows comparison of a grower’s current seeding rate practices against other growers planting the same hybrid in similar environments.

What aggregated community data CANNOT tell you:

  • Community data do not provide any insight on whether or not the seeding rates employed by other growers in the network were the “right” seeding rates for those environments.
    • Since community data typically do not include comparisons of multiple seeding rates within an environment, there is no way of determining what the optimum seeding rate for an environment would have been.
  • Community data do not provide a grower any insight on the optimum seeding rate for a hybrid when making planting decisions.
  • Community data do not account for hybrid agronomic characteristics, such as root or stalk strength, that may be important in seeding rate decisions.
  • Additionally, community data can be biased by numerous environmental factors such as flooding, wind damage, or early-season stress causing stand loss; all of which would likely result in trial data being excluded from a research dataset.

Aggregated community data can be a useful supplement to research data for making seeding rate decisions; however, IT IS NOT A VIABLE SUBSTITUTE for controlled-trial data in characterizing genetic differences in plant population response.
Characterizing Genetic Differences in Hybrid Response to Plant Population

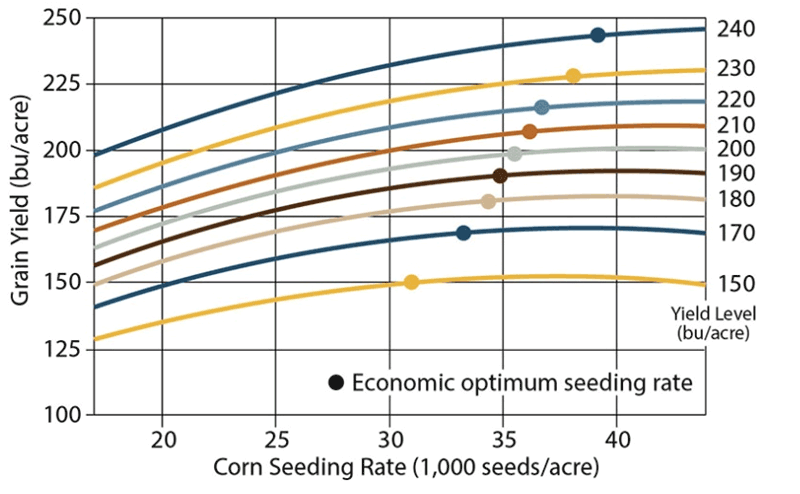
  • When tested over a large enough range, corn yield response to plant population follows a quadratic response curve – yield increases with plant population up to a maximum point and then gradually decreases with seeding rates above the optimum.
  • In order to fully characterize the plant population response for a hybrid, it is necessary to test the hybrid over a wide range of populations, including populations well-below and above the optimum.
  • Plant population response can also vary by yield level, with higher yield environments having a greater optimum population (Figure 2). Characterizing hybrid population response to yield level requires testing multiple populations across a wide range of environments.

Corn yield response to population and optimum economic seeding rate by location yield level, 2009 to 2015.

Figure 2. Corn yield response to population and optimum economic seeding rate by location yield level, 2009-2015.

(Averaged across all hybrids tested. Economic optimums based on a corn grain price of $4.00/bu and a seed cost of $3.00 per 1,000 seeds; assumes 5% overplant to achieve target population.)
Pioneer Research

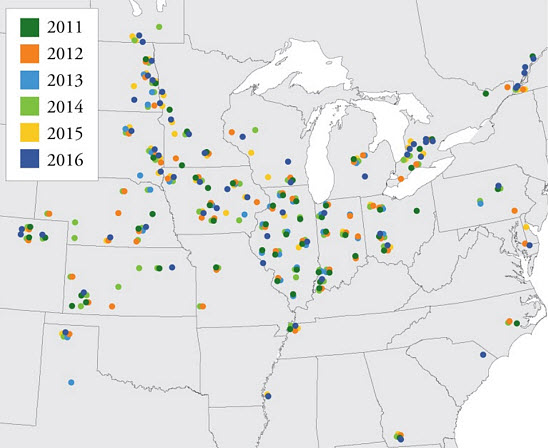
  • Pioneer has conducted plant population research at more than 260 locations throughout the U.S. and Canada in the last 5 years. Research trials include populations ranging from 18,000 to 50,000 plants/acre (Figure 3).
  • Pioneer researchers target representative environments based on maturity zone, expected yield (high or low), specific stresses (drought, pest pressure, high residue, early planting, etc.), and other unique location characteristics.
  • Additionally, Pioneer agronomists conduct hundreds of on-farm Pioneer® GrowingPoint® agronomy trials each year comparing multiple hybrids and plant populations at each location, over a wide range of environments. More than 1,300 of these trials were conducted in the U.S. and Canada in 2015 (Figure 4).
  • The Pioneer Planting Rate Estimator allows users to generate estimated optimum seeding rates for Pioneer® brand corn products based on data from Pioneer research.

Pioneer plant population research locations in North America - 2011-2015.

Figure 3. Pioneer plant population research locations in North America, 2011-2015.
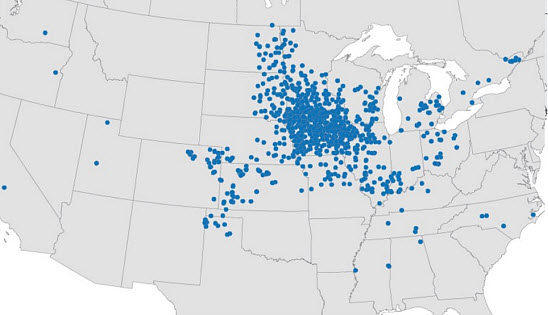
Pioneer GrowingPoint agronomy on-farm seeding rate trials at 1,378 locations in North America in 2015.

Figure 4. Pioneer GrowingPoint agronomy on-farm seeding rate trials at 1,378 locations in North America in 2015.


The foregoing is provided for informational use only. Please contact your Pioneer sales professional for information and suggestions specific to your operation. Product performance is variable and depends on many factors such as moisture and heat stress, soil type, management practices and environmental stress as well as disease and pest pressures. Individual results may vary.