Remote Sensing Applications in Crop Production
Crop Insights written by Mary Gumz, Ph.D.1, T.C. Huffman2, Eric Galdi3, and Mark Jeschke, Ph.D.4
Crop Insights written by Mary Gumz, Ph.D.1, T.C. Huffman2, Eric Galdi3, and Mark Jeschke, Ph.D.4
Remote sensing involves detecting and measuring the physical characteristics of an object from a distance. In crop production applications, this typically entails assessing attributes of a growing crop from an aerial- or satellite-based platform by measuring reflectance of solar radiation from the crop canopy.
Remote sensing offers the advantage of enabling measurements to be taken quickly over a large area, which can reveal spatial variation that may not be apparent via ground-based observation. Repeated measurements over time can detect changes in crop condition during the growing season.
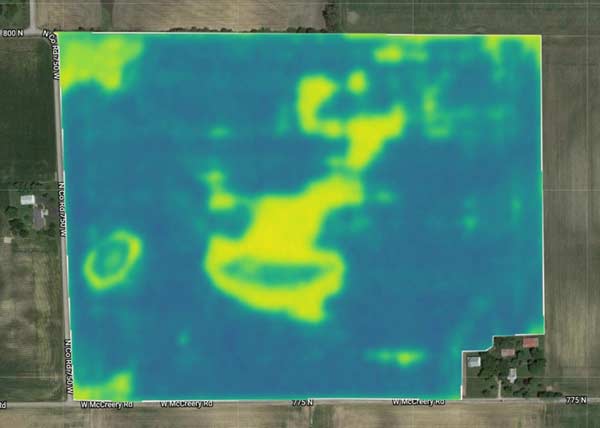
Granular Insights Vegetation Index map showing spatial variation in crop health across a field.
Remote sensing technology has been around for a long time, dating back to the launch of the first earth-imaging satellite Landsat 1 in 1972. Throughout most of that history, the practical application of remote sensing for crop management has been limited by the cost, frequency, and resolution of imagery. Today, however; advances in technology have made remote sensing a useful, convenient, and cost-effective tool available to all crop producers.
This Crop Insights discusses some of the basics of satellite and aerial imagery, applications available through Granular Insights and Pioneer agronomists, and some examples of crop growth problems detected and diagnosed through remote sensing to guide field scouting.
Remote sensing in crop production involves quantifying wavelengths of solar radiation reflected by a crop canopy. Incoming solar radiation can be absorbed, transmitted (pass through the canopy), or reflected. Plants vary in their reflectance properties. Different species can have different reflectance patterns, but reflectance can also be indicative of the condition of the plant. Plants suffering some sort of stress such as drought or nutrient deficiency can have a reflectance pattern that differs from that of healthy plants.
Remote sensing technology can quantify reflectance wavelengths within as well as outside of the visible light spectrum (400 to 750 nm). The wavelength bands most commonly used for measurements of vegetation are the red, green, blue, and near-infrared (NIR) bands (Figure 1). All plants have a peak in reflectance in the green band (520-600 nm). Reflectance is lowest in the blue band (450-520) and red band (630-680 nm), as these are the wavelengths absorbed for photosynthesis. The NIR band lies just outside the visible spectrum (760-900 nm) and is a very useful band for measuring plant condition. There can be substantial variation in NIR reflectance by plants. Green, healthy plants generally reflect more radiation in the NIR band than plants experiencing some sort of stress.
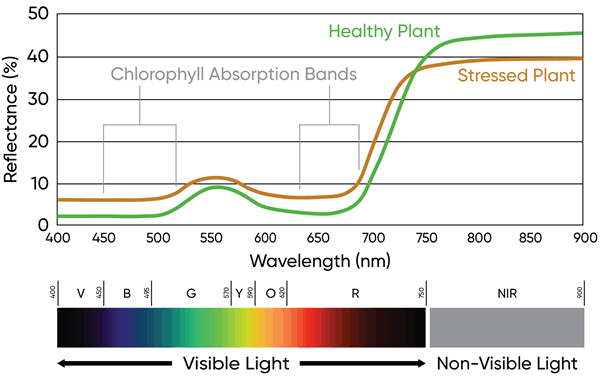
Figure 1. Generalized electromagnetic radiation reflectance profiles of healthy and stressed plants.
Vegetation Indices
The relative amount of reflectance in the different bands can be used as indicators of plant health, referred to as vegetation indices. Many different vegetation indices have been developed over the years geared toward different applications. The most commonly used vegetation index is the normalized difference vegetation index (NDVI) which has been used across a wide range of applications since its development in the early 1970s (Rouse et al., 1974). NDVI is calculated based on reflectance in the red and NIR bands,
NDVI = (ρNIR - ρRED) / (ρNIR + ρRED)
where ρNIR and ρRED represent spectral reflectance in the NIR and red bands. The main disadvantage to using NDVI in crop production applications is that it approaches saturation asymptotically under moderate to high plant biomass levels, which means that small variations in crop health may not be adequately captured in the index value. In practice, NDVI is generally effective at characterizing spatial variability in plant health, providing a snapshot of the good and bad parts of a field. NDVI is not as good for tracking changes in crop condition over time; as it takes a large change in the ρNIR to alter the NDVI.
The Vegetation Index in Granular Insights (Figure 2) utilizes a variation on NDVI called the wide dynamic range vegetation index (WDRVI) (Gitelson, 2004). WDRVI enhances the dynamic range of NDVI by applying a weighting parameter α to the NIR reflectance (ρNIR).
WDRVI = (α∗ρNIR - ρRED) / (α∗ρNIR + ρRED)
The application of the weighting parameter linearizes the relationship between the index value and ρNIR which increases the sensitivity of the index to small variations in high-density vegetation. The Vegetation Index in Granular Insights utilizes a weighting parameter of α=0.2, which was determined through empirical studies to provide WDRVI estimates that best characterize LAI (leaf area index) in cropping systems. This allows WDRVI to capture more subtle differences in leaf health and better detect changes in crop condition over time.
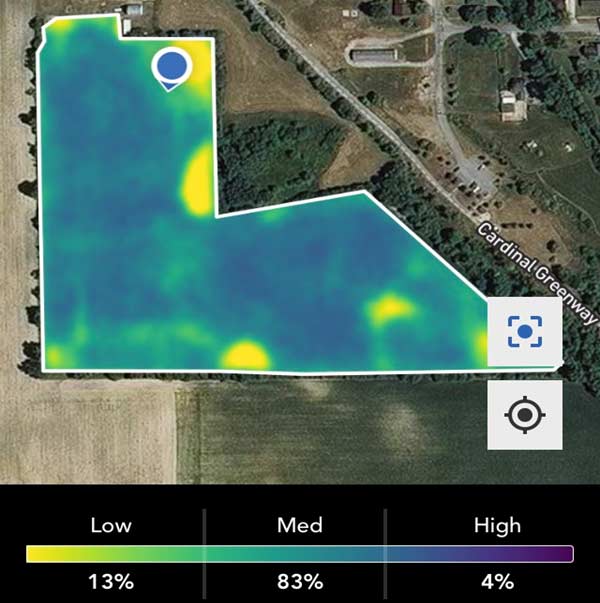
Figure 2. Granular Insights Vegetation Index map showing spatial variation in crop health across a field based on the wide dynamic range vegetation index (WDRVI). The user’s position in the field indicated by the blue dot.
Satellite Imagery
The era of satellite-based remote sensing began with the launch of Landsat 1 in 1972 as a part of the Earth Resources Satellite Program. This was the first satellite deployed with the sole purpose of studying and monitoring Earth’s surface. Landsat 1 was equipped with two sensor arrays operating in seven total spectral bands and had a spatial resolution of 80 meters. Additional remote sensing satellites were deployed in subsequent years, but their utility for crop production was limited by their coarse spatial resolution and infrequent images. (Landsat 1 had a repeat cycle of 18 days.)
Aerial Imagery
Initial research using aircraft-based remote sensing platforms for crop production also began in earnest in the 1970s. Research demonstrated the utility of infrared aerial photography for identifying stressed areas of agricultural crops. This technique was widely used in irrigated areas and for high-value crops such as fruits and vegetables. Advances in precision agriculture technology in the 1990s and 2000s led to widespread interest in using both satellite- and aircraft-based remote sensing as a basis for site-specific management (Peterson et al., 1998). An aircraft-based platform has the advantage of greater spatial resolution, as well as greater scheduling flexibility and lack of cloud interference in the imagery.
However, the cost and complexity associated with flying manned, fixed-wing aircraft limits their viability as a remote sensing platform, particularly given that much of the potential value in remote sensing derives from getting imagery frequently throughout the growing season so problems can be detected and addressed as they manifest.
Today, advances in both satellite and aircraft technology have made remote sensing both practical and cost-effective for crop producers in a way that it never has been before. Better and cheaper satellite technology has allowed the deployment of constellations of multiple satellites that provide higher spatial and temporal resolution. In 2013, a total of 18 remote sensing satellites had been put into orbit; by 2017 that number had increased to 177. Likewise, the development of inexpensive and user-friendly small unmanned aerial systems (sUAS) has now made aircraft-based remote sensing a very practical and useful tool for crop production (Figure 3).
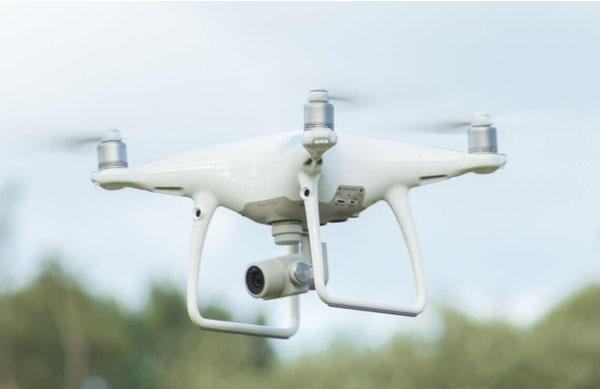
Figure 3. Rapid advancements in small unmanned aerial systems have made aerial imagery applications in agriculture much more useful, economical, and accessible compared to older manned aircraft-based platforms.
Modern remote sensing technologies can make on-the-ground scouting much more efficient by directing scouting efforts to fields and areas within fields where an anomaly in crop progress has been detected. Frequent satellite-based crop imagery can alert farmers to potential problems as they appear. Once a problem has been detected, sUAS can be used to get a closer look at the field and either diagnose the problem or determine that scouting is necessary.
Satellite Imagery
High frequency, high resolution satellite imagery is now readily available to farmers through the Granular Insights app. Granular Insights allows farmers to easily monitor all of their fields through a desktop computer or mobile device. Granular Insights utilizes satellite imagery from Planet Labs, generated by a constellation of over 160 satellites. The large number of satellites allows a very high frequency of imagery – multiple times per week depending on cloud cover. A spatial resolution as fine as 3 meters greatly improves the ability to monitor spatial variation in crop progress relative to older, coarser-resolution imagery.
User Features
Granular Insights also provides tools to help quickly convert the intake of crop imagery into insights for scouting and crop management decisions. Imagery data is analyzed to detect changes in crop condition that suggest there may be a problem in a field that requires attention, which is then used to create Scout Prioritybeta field rankings. Users are provided weekly email notifications with a ranked list of the top fields by crop in need of scouting based on the Scout Prioritybeta score. This allows for targeted scouting without the need to manually sort through and visually inspect numerous images. The “Find Me” feature enables efficient, directed scouting by showing a GPS-enabled blue dot on the field image to track the user’s location and guide them to where the problem is in the field (Figure 2).
Rapid advancement in sUAS technology over the past several years has been a game-changer for aerial remote sensing in crop research and production. Corteva Agriscience currently operates the largest sUAS fleet in the world with over 575 aircraft in operation. Initial applications of sUAS-based data collection in crop research began several years ago, and sUAS are now widely-implemented throughout the Corteva Agriscience research organization. Use of sUAS has expanded into field sales and seed production as well. All Corteva Agriscience UAS pilots are FAA-licensed and complete a comprehensive pilot training program.
Stand Evaluation
One of the most important applications of sUAS technology that spans research, field sales, and seed production at Corteva Agriscience is crop stand evaluation. Imagery-based stand evaluation provides vast improvements in speed and efficiency over traditional stand counting. Proprietary software technology is able to detect individual plants in images, quickly providing an assessment of stand establishment (Figure 4). In addition to measuring plants per unit area, imagery-based stand evaluation also allows rapid quantification of gaps in the stand.
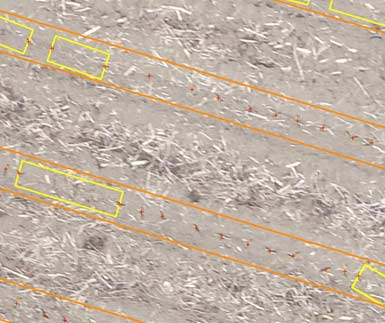
Figure 4. Corteva Agriscience image analysis software is able to detect individual plants (marked with red dots) and gaps in stand (marked with yellow boxes), providing a robust characterization of stand establishment.
Stand evaluation using sUAS allows stand count data to be sampled from all parts of a field in a short amount of time, providing a more complete picture of overall stand establishment than can be achieved using traditional methods. A typical stand evaluation flight plan can cover an average sized field in around 10-15 minutes (Figure 5). Each sample point encompasses a sample area of around 1/10 of an acre within an image, compared to the typical sample size of 1/1000 of an acre using traditional methods.
Enhanced Scouting
sUAS are valuable tools for enhanced crop scouting, particularly later in the growing season when crops are taller and movement and visibility within the field is more restricted. An overhead view can reveal localized crop health issues and patterns in the field that may not be visible from the ground. When used in conjunction with Granular Insights imagery, sUAS can be used to take a closer look at anomalies revealed by satellite imagery.
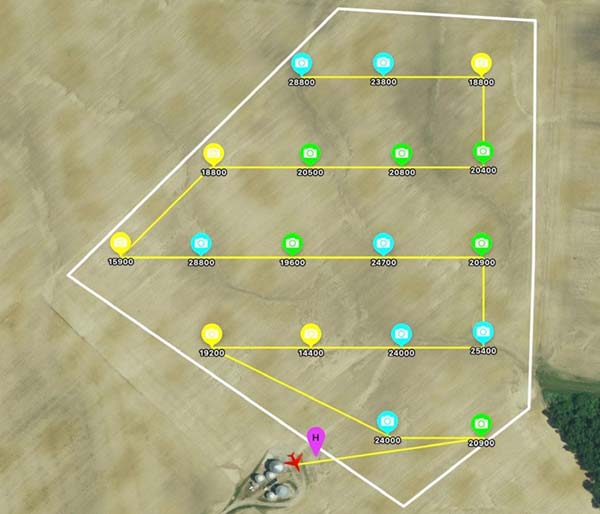
Figure 5. A typical stand evaluation flight plan showing 18 1/10 acre sample points distributed throughout the field.
sUAS imagery can also be used to assess crop health across an entire field. Corteva Agriscience has partnered with DroneDeploy to bring advanced, real-time mapping capabilities to its sUAS fleet. Using this software, an agronomist can survey a 160-acre field in less than 15 minutes, quickly spotting variations in plant health. The software provides real-time stitching of video feed imagery and can generate a plant health evaluation map based on sUAS imagery (Figure 6).

Figure 6. DroneDeploy plant health evaluation map based on sUAS imagery.
Satellite and aerial remote sensing can greatly increase the speed and efficiency of field scouting and subsequent crop management decision making. What follows are a few examples of crop management scenarios in which satellite and aerial imagery provided valuable crop management insights.
Management Zone Diagnostics - Oklahoma
In this field, both Granular Insights and DroneDeploy crop health imagery revealed an area of better crop health relative to the rest of the field in the northeast corner (Figure 7). The difference was determined to be due to the cropping history of the field. The northeast portion of the field was a pasture 15 years prior, and the soil in this area had higher organic matter levels – around 3%, compared to 1.5-2.0% for the rest of the field.
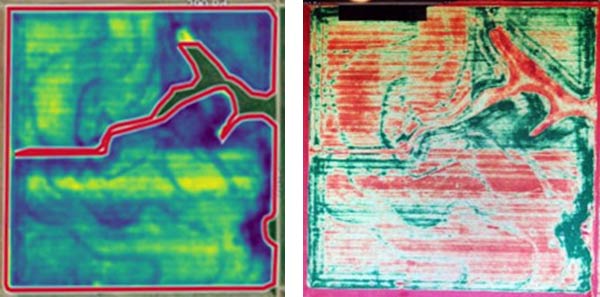
Figure 7. Granular Insights (left) and DroneDeploy (right) crop health imagery both showing an area of greater crop health in the northeast quarter of the field.
Corn Rootworm Damage - Ohio
Granular Insights imagery showed that this field had a small area of relatively poor crop health developing in the northwest corner of the field (Figure 8). Viewing the change in crop health over the prior weeks showed that this was a recent development. DroneDeploy crop health imagery focused on this portion of the field taken several days later confirmed these findings and showed that the area of poor crop health had expanded. It was determined that on-the-ground scouting was needed to diagnose the problem. Scouting revealed that the decline in crop health was caused by corn rootworm injury (Figure 9).
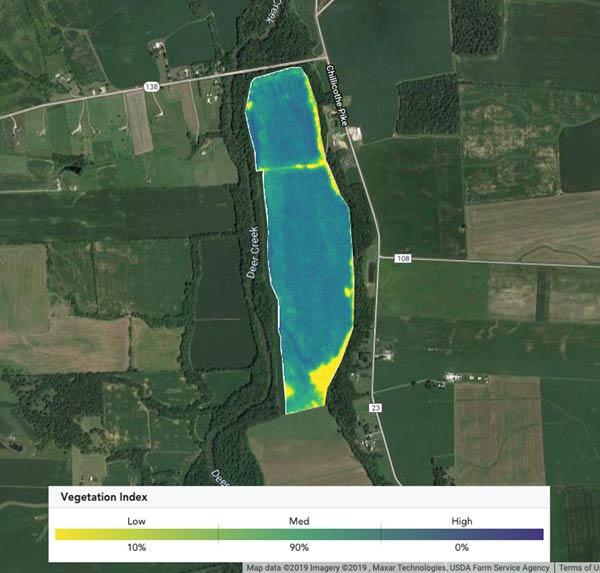
Figure 8. Granular Insights Vegetation Index map on July 6 showing a small area of declining crop health in the northwest corner of the field.
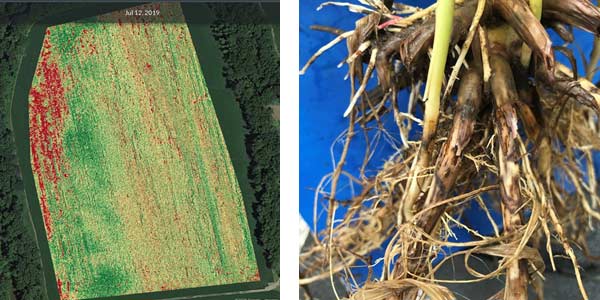
Figure 9. DroneDeploy crop health imagery in July confirmed an area of poor crop health in the field (left). Scouting revealed corn rootworm injury in this area (right).
Storm Damage - Illinois
In this field, Granular Insights imagery showed alternating bands of good and reduced crop health in the field (Figure 10). The field was planted with two hybrids in a split-planter configuration and follow-up scouting revealed extensive wind damage to one of the two hybrids, accounting for the banded pattern in the imagery.
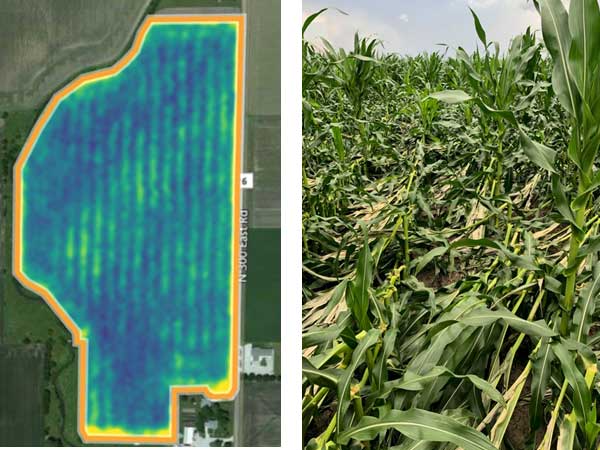
Figure 10. Granular Insights imagery showing alternating bands of reduced crop health in a field in Illinois (left) and wind damage discovered in the field (right).
For most of its history, remote sensing in agriculture has existed in the realm of technologies that offer tremendous potential but are too expensive and cumbersome to deploy on a wide scale. That is no longer the case - high-quality, cost-effective, and convenient remote sensing tools and technology are available now. Granular Insights allows farmers to proactively monitor crop progress on a computer or mobile device using near-daily imagery from the world’s largest constellation of remote sensing satellites.
Aerial imagery from Corteva Agriscience’s industry-leading sUAS fleet, coupled with DroneDeploy advanced mapping software, can reveal yield-limiting stresses and help guide field scouting. Information derived from implementation of these technologies allows for faster and more informed crop management decision making.
To learn more about Granular farm management software and services, visit granular.ag.
1Mary Gumz, Ph.D., Commercial Unit Agronomy Manager
2T.C. Huffman, Area Digital Services Manager
3Eric Galdi, Agronomy Systems Manager
4Mark Jeschke, Ph.D., Agronomy Manager
The foregoing is provided for informational use only. Contact your Pioneer sales professional for information and suggestions specific to your operation. Product performance is variable and subject to any number of environmental, disease, and pest pressures. Individual results may vary. Pioneer® brand products are provided subject to the terms and conditions of purchase which are part of the labeling and purchase documents.
November 2019