
Country Selector
Please enter a valid location
- Key Findings:
- Hybrid Response to Population – 2023 Trials
- Results
Key Findings:
- Optimum plant population was greater in higher yielding environments than in lower yielding environments.
- Pioneer® P9026AM™ and P9466AML™ brand corn differed in their response to plant population, and optimum population for maximum yield.
- Kernel weight declined with increasing population. Kernel weight was similar between the two hybrids at lower population but diverged slightly at higher populations.
Hybrid Response to Population – 2023 Trials
- On-farm trials evaluating corn hybrid response to plant population were conducted at 14 locations across Central/Eastern Ontario in 2023.
- Hybrids were planted at 4 different populations at each location. Most locations included four populations: 26,000, 30,000, 34,000, and 38,000 plants/acre.
- A total of eight different Pioneer® brand corn products were included in the study, with Pioneer P9026AM™ (AM,LL,RR2) and P9466AML™ (AML,LL,RR2) brand corn included at most locations (Table 1).
- Each location had either 1 or 2 replications.
- Average kernel weight was measured at 10 locations in 2023 for Pioneer® P9026AM™ and P9466AML™ brand corn.
Table 1. Pioneer brand corn products included in 2023 on-farm population trials and the number of locations for each.
Hybrid/Brand | Number of Locations |
P9026AM™ (AM,LL,RR2) | 10 |
P9316Q™ (Q,LL,RR2) | 1 |
P9466AML™ (AML,LL,RR2) | 12 |
P9492AM™ (AM,LL,RR2) | 1 |
P9624Q™ (Q,LL,RR2) | 1 |
P9845PCE™ (PW,ENL,RIB) | 1 |
P96760Q™ (Q,LL,RR2) | 1 |
P97299AM™ (AM,LL,RR2) | 1 |
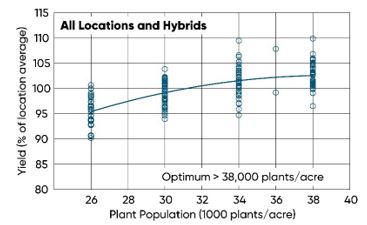
Figure 1. Corn yield response to population across all hybrids and locations. Corn yield is expressed as a percent of the location average.
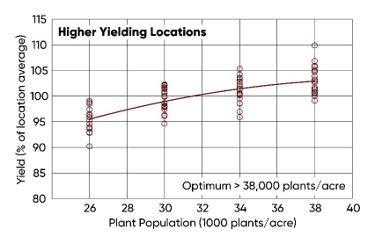
Figure 2. Corn yield response to plant population at seven higher yield level locations. (Location average >235 bu/acre.)
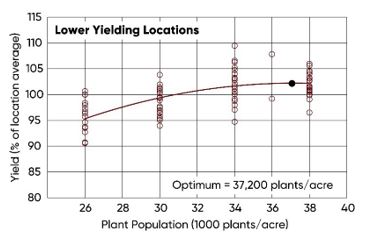
Figure 3. Corn yield response to plant population at seven lower yield level locations. (Location average < 235 bu/acre).
Results
2023 Population Trials
- The agronomic optimum plant population across all hybrids and locations was above the highest population in the study of 38,000 plants/acre (Figure 1).
- On-farm trial locations were separated out as higher or lower yielding based on the average yield of the location to determine if yield response to plant population differed by yield level.
- Seven locations were classified as lower yielding, with a location average yield of 215-235 bu/acre.
- Seven locations were classified as higher yielding, with a location average yield of 235-280 bu/acre.
- Higher yielding environments would be expected to have a higher optimum plant population and that proved to be the case in this study.
- As was the case across all locations, the optimum plant population for the higher yielding subset of locations was above the highest population in the study of 38,000 plants/acre (Figure 2).
- For lower yielding locations, the agronomic optimum plant population was slightly below the top end of the study range at 37,200 plants/acre. (Figure 3).
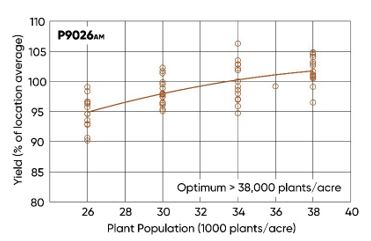
Figure 4. Yield response of Pioneer P9026AM to plant population.
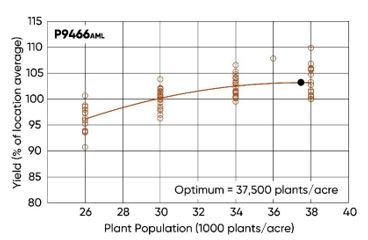
Figure 5. Yield response of Pioneer P9466AML to plant population.
2023 Hybrid Comparison
- This study included two Pioneer® brand corn products, P9026AM™ and P9466AML™, that were planted at the majority of trial locations.
- The optimum plant population for P9026AM was above the population range of the study (>38,000 plants/acre) (Figure 4).
- The optimum plant population for P9466AML was 37,500 plants/acre (Figure 5).
Multiyear Results: 2021-2023
- 2023 was the third year that corn population trials were conducted across Central and Eastern Ontario.
- In 2021, population trials across 16 locations including populations of 28,000, 32,000, 36,000, and 40,000 found an agronomic optimum of 37,600 plants/acre.
- In 2022, population trials were conducted across 22 locations with a slightly lower population range of 26,000, 30,000, 34,000, and 38,000 and the agronomic optimum was above the range of the study.
- Across all 52 site-years of the study from 2021-2023, the agronomic optimum population was above the top end of the population range of 40,000 plants/acre (Figure 6).
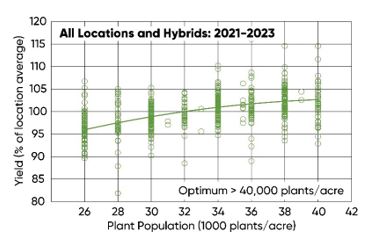
Figure 6. Yield response to plant population across all hybrids and locations from 2021-2023.
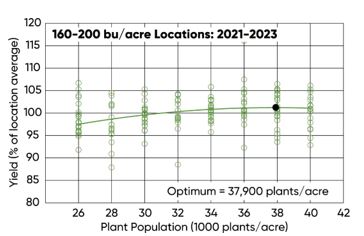
Figure 7. Yield response to plant population across 17 low yield locations (location average 160-200 bu/acre) from 2021-2023.
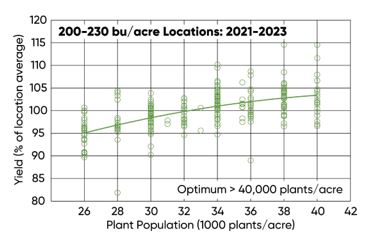
Figure 8. Yield response to plant population across 23 moderate yield locations (location average 200-230 bu/acre) from 2021-2023.
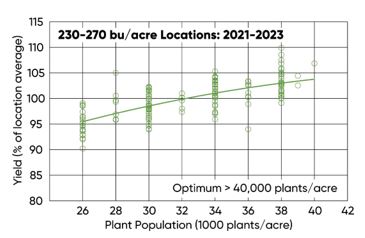
Figure 9. Yield response to plant population across 16 high yield locations (location average 230-280 bu/acre) from 2021-2023.
- All plant population trial site-years from 2021 to 2023 were separated into three yield classifications: low (160-200 bu/acre), moderate (200-230 bu/acre), and high (230-280 bu/acre).
- Only the lower yielding locations had an agronomic optimum plant population that fell within the population range of the study (Figure 7).
- For the moderate and high yielding locations, yield was greatest at the top end of the population range.
2023 Kernel Weight
- Average kernel weight was measured at 10 locations in 2023 for Pioneer® P9026AM™ and P9466AML™ brand corn (Figure 10).
- Kernel weight was relatively high in this study, with an average of 73,460 kernels/bushels. Even at the highest population, kernels/bushels did not exceed 80,000 (Figure 10).
- Kernel weight declined with increasing population. Kernel weight was similar between the two hybrids at lower population but diverged slightly at higher populations.
- A balance between kernels per bushels and kernels per acre is needed to maximize agronomic and economic returns.
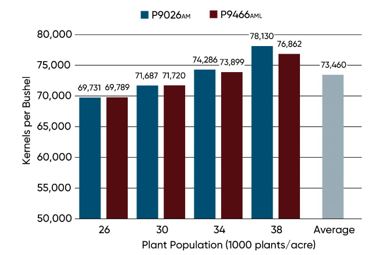
Figure 10. Kernels per bushel by hybrid and population across 10 study locations in 2023.
- For other hybrid population recommendations, please check out the Pioneer Planting Rate Estimator at: https://www.pioneer.com/ca-en/tools-services/planting-rate- estimator.html
- Local research is ideal for population setting. Talk to your Pioneer Sales Representative.
Special thanks to our co-operators and project supporters:
Eastern Ontario: Emerald Acres, J&H Nixon Farms, Hog Haven Inc., Golden Rail Farms, Vernon Valley Farms, Fife Agronomics, Dutchbern Farms, Jim Parks, David Renaud and Marc Heeney
Central Ontario: Reesor Seed & Grain, Parbro Farms Ltd., Ryan Svendsen, Ray Cann Farming Ltd., Glen Isle Farms Ltd., Jeff Harrison Farms Ltd., Hollowdale Cattle Company Ltd., Greydafton Farms Inc.