
Country Selector
Please enter a valid location
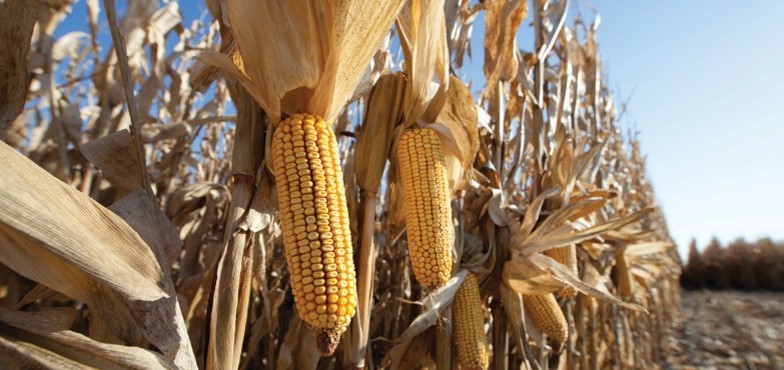
Moisture Loss During Grain Fill
- Kernels lose moisture through the grain filling period due to a combination of evaporative water loss and accumulation of kernel dry matter
- Corn plants channel photosynthate into the kernels during the grain fill period, increasing kernel dry weight.
Table 1. Days following silking to reach corn reproductive growth stages and approximate grain moisture (Abendroth et al., 2011).
Growth Stage | Days After Silking | Approx. Moisture |
Blister Stage (R2) | 10-12 | 85% |
Milk Stage (R3) | 18-20 | 80% |
Dough Stage (R4) | 24-26 | 70% |
Dent Stage (R5) | 31-33 | 60% |
Maturity (R6) | 64-66 | 35% |
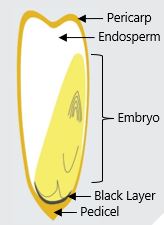
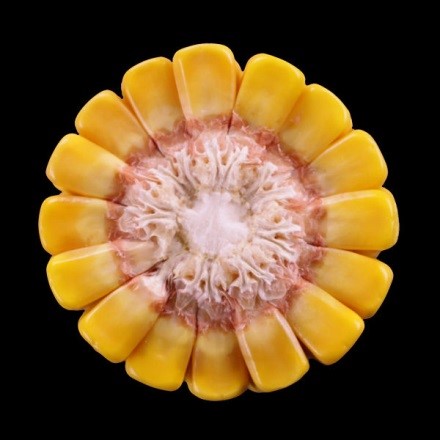
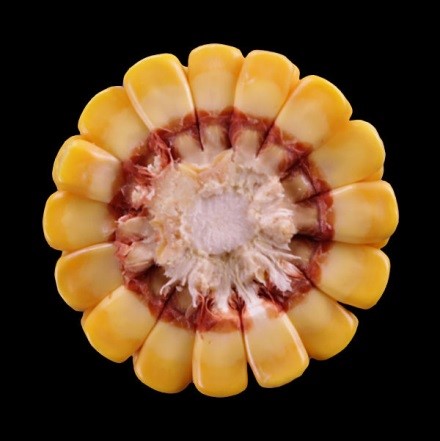
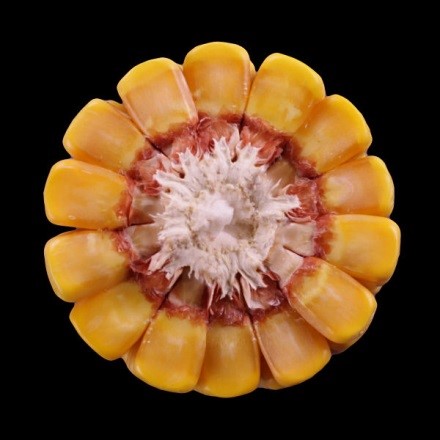
Physiological Maturity and Black Layer
- Physiological maturity is the point at which the hard starch layer reaches the base of the kernel and kernel dry matter accumulation is complete.
- Kernel moisture at physiological maturity is typically around 35% but can vary due to differences in hybrid characteristics and environmental conditions.
- Following physiological maturity, an abscission layer, known as the black layer, will form at the base of the kernel.
- Within the ear, the black layer usually forms first in the tip kernels with progression a few days later to the large kernels at the base.
Black Layer Formation
- In early seed development, a black layer forms in a region of cells several layers thick between the endosperm base of the kernel and the vascular area of the pedicel.
- Near physiological maturity, these cells compress into a dense layer, which appears visibly black.
- Concurrently, the cells at the base of the endosperm also become crushed. These are specialized vascular cells, which absorb and transfer nutrients to the kernel, plus sucrose and other sugars produced by the plant in photosynthesis.
- This stops their capability for movement of sugars and nutrients from within the plant into the kernel.
Stage R5
Beginning Dent
Milk line starting to appear at top of kernel
Grain Moisture: ~50-55%
400 GDUs remaining to maturity
Yield loss from killing frost at this stage: 35-40%
Stage R5.25
1/4 milk line
Grain Moisture: 45-50%
300 GDUs remaining to maturity
Yield loss from killing frost at this stage: 25-30%
Stage R5.75
3/4 milk line
Grain Moisture: 35-40%
100 GDUs remaining to maturity
Yield loss from killing frost at this stage: 5-6%
Stage R5.5
1/2 milk line
Grain Moisture: 40-45%
200 GDUs remaining to maturity
Yield loss from killing frost at this stage: 12-15%
Stage R6
Physiological maturity
Grain Moisture: 30-35%
0 GDUs remaining to maturity
Yield loss from killing frost at this stage = 0%
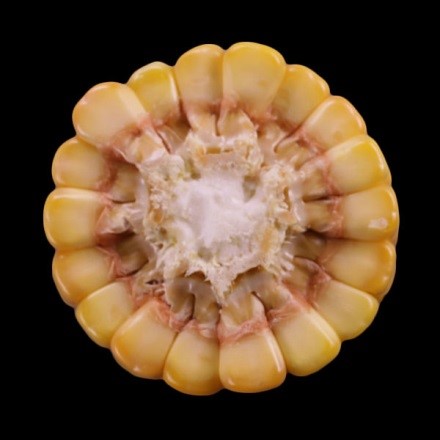
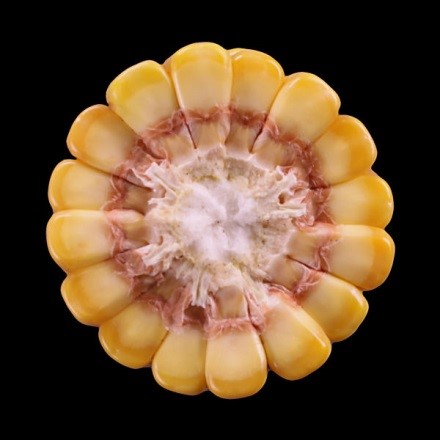
- Black layer is often used as a visual indicator of physiological maturity and the two are often considered synonymous, but this is not actually the case.
- Black layer formation is triggered when sucrose trans-location to the developing kernel stops.
- This cessation of sucrose flow can be due to the physiological maturity of the kernel but can also be the result by other factors causing a sharp drop in plant photosynthesis such as foliar disease, hail, frost, or prolonged cold temperatures.
- Black layer formation triggered by environmental stress can occur before physiological maturity, effectively shutting down grain fill prematurely.
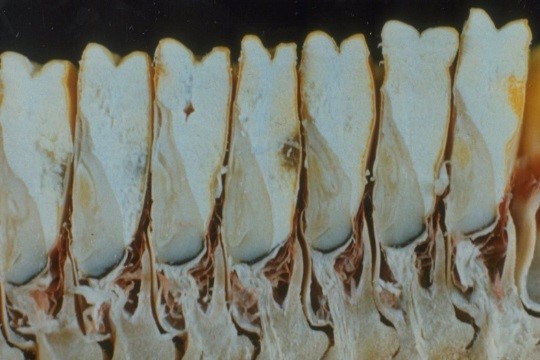
Cross section of kernels following physiological maturity. The black abscission layer is visible at the tip of the kernels.
Dry Down Following Maturity
- Kernel drying that occurs following black layer is entirely due to evaporative moisture loss.
- Corn dry down rate is tightly linked to daily growing degree unit (GDU) accumulation.
- In general, drying corn from 30% down to 25% moisture requires about 30 GDUs per point.
- Drying from 25% to 20% requires about 45 GDUs per point (Lauer, 2016).
- GDU accumulation and dry down rates are greatest during the earlier, warmer part of the harvest season and decline as the weather gets colder (Table 2 and 3).
- By November, GDU accumulation rates are low enough that little further drying will typically occur.
Table 2. Average daily GDU accumulation during early-, mid-, and late-September and October for several Midwestern locations (1981-2010 average, Midwest Regional Climate Center).
September | October | |||||
1-10 | 11-20 | 21-30 | 1-10 | 11-20 | 21-31 | |
Lincoln, NE | 20 | 17 | 14 | 11 | 8 | 7 |
Indianapolis, IN | 20 | 16 | 13 | 11 | 8 | 6 |
Bloomington, IL | 20 | 17 | 13 | 12 | 8 | 6 |
Ames, IA | 18 | 14 | 12 | 10 | 7 | 5 |
Mankato, MN | 17 | 13 | 10 | 8 | 6 | 4 |
Madison, WI | 16 | 14 | 11 | 9 | 6 | 4 |
Brookings, SD | 15 | 12 | 9 | 7 | 5 | 3 |
Table 3. Average daily corn dry down rate for difference stages of the harvest season (Hicks, 2004).
Harvest Season Stage | Points of Moisture per Day |
Sept. 15 – Sept. 25 | ¾ to 1 |
Sept. 26 – Oct. 5 | ½ to ¾ |
Oct. 6 – Oct. 15 | ¼ to ½ |
Oct. 16 – Oct. 31 | 0 to ⅓ |
Nov. 1 and later | ~0 |
Timing of Physiological Maturity
- Corn that matures earlier will dry down faster due to more favorable drying conditions early in the harvest season.
- Later maturing corn has fewer warm days to aid in drying, and will dry down at a slower rate.
Weather Conditions Following Maturity
- Daily GDU accumulation and dry down can vary widely during the harvest season.
- Corn may dry 1 point of moisture per day or more under favorable conditions.
- Conversely, corn may not dry at all on a cool, rainy day.
Hybrid Characteristics Affecting Dry Down
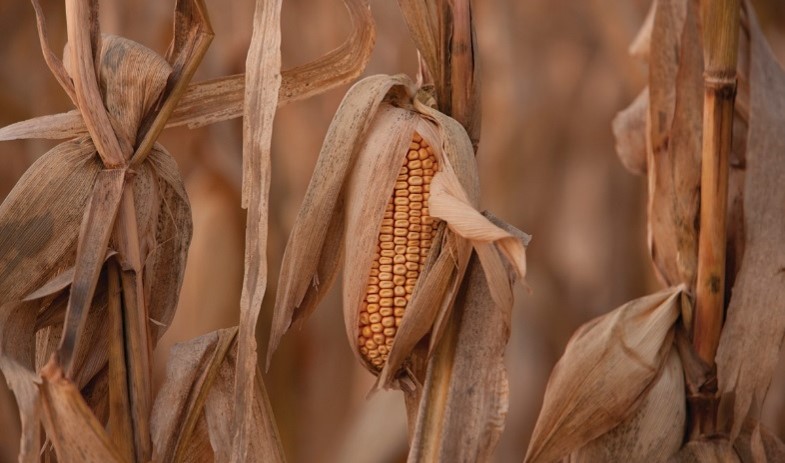
Husk leaf coverage – The more insulated the ear is, the longer it will take to dry down. Leaf number, thickness, and tightness all affect dry down rate.
Husk leaf senescence – the sooner these leaves die, the faster the grain will dry down.
Ear angle – Upright ears are more prone to capture moisture in the husks which slows dry down.
Kernel pericarp characteristics – Thinner or more permeable pericarp layers are associated with a faster dry down rate.
References
Abendroth, L.J., R.W. Elmore, M.J. Boyer, and S.K. Marlay. 2011. Corn Growth and Development. PMR 1009. Iowa State University Extension, Ames, Iowa.
Hicks, D.R. 2004. The Corn Crop – Frost and Maturity. Univ. of Minnesota.
Lauer, J. 2016. Corn Harvesting. Univ. of Wisconsin-Madison Extension, Madison, Wisconsin.
Author: Mark Jeschke
Vol. 11 No. 35 August 2019
The foregoing is provided for informational use only. Please contact your Pioneer sales professional for information and suggestions specific to your operation. Product performance is variable and depends on many factors such as moisture and heat stress, soil type, management practices and environmental stress as well as disease and pest pressures. Individual results may vary.