
Country Selector
Please enter a valid location
- Key Findings
- 2021 Corn Dry Down and Field Research
- References
Key Findings
- Trial locations accumulated an average of 193 GDUs over the 3-week study period and lost an average of 4.9 points of grain moisture.
- 91 to 95 CRM hybrids all dried down at a similar rate, while 96-98 CRM hybrids were at least a point wetter on all sampling dates.
- For each week delay in planting, grain moisture increased by an average of 1.9 pts.
2021 Corn Dry Down and Field Research
- Corn ear samples were collected from 11 field trial locations in Eastern Ontario to measure the rate of in-field drying prior to harvest in 2021.
- Trials included 2 to 7 different hybrids ranging in comparative relative maturity (CRM) from 88 to 100 (Table 1).
- Planting dates of field trials ranged from April 29 to May 20.
- Representative ears were sampled from each hybrid in the trial four times: Oct. 3, Oct. 10, Oct. 17, and Oct. 23.
- Sampled ears were hand-shelled and grain moisture was measured using benchtop moisture testing equipment or a calibrated moisture tester.
Table 1. Planting dates and comparative relative maturity of hybrids planted at dry down study locations in 2021.
Planting Date | Hybrid Comparative Relative Maturity | ||||||||
88 | 91 | 92 | 93 | 94 | 95 | 96 | 98 | 100 | |
Number of hybrids | |||||||||
May 3 | 1 |
| 1 | 1 | 1 | 1 | 1 |
|
|
May 13 | 1 |
|
| 1 | 1 | 1 | 1 | 1 |
|
April 29 |
| 1 | 1 | 1 | 1 | 1 |
|
| 1 |
May 16 |
| 1 | 1 | 1 |
| 1 |
|
|
|
May 16 |
| 1 | 1 | 1 | 1 | 1 | 1 | 1 |
|
May 17 |
| 1 | 1 | 1 |
| 1 | 1 | 1 |
|
May 20 |
| 1 | 1 | 1 |
| 1 | 1 | 1 |
|
May 7 |
|
| 1 | 1 | 1 | 1 |
|
|
|
May 10 |
|
|
| 1 | 1 | 1 |
|
|
|
May 15 |
|
|
| 1 |
| 1 |
|
|
|
May 12 |
|
|
|
| 1 | 1 | 1 | 2 |
|

Accumulated growing degree units (GDUs) for each trial location were estimated using the GDU calculator.

Figure 1. Dry down study locations in Eastern Ontario in 2021.
Results
- Trial locations accumulated an average of 193 GDUs over the course of the study period: 69 in week 1, 103 in week 2, and 21 in week 3 (Figure 2).
- Average grain moisture across all locations and hybrids was 30.0% at the start of the study and 25.1% at the end of the study, meaning that grain dried down an average of 1 point per 40 GDUs (Figure 3).
- Average dry down rate was greatest during the second week of the study (Figure 3), which was the period with the most GDU accumulation (Figure 1).
- GDU accumulation and dry down were both minimal during the third week of the study period.
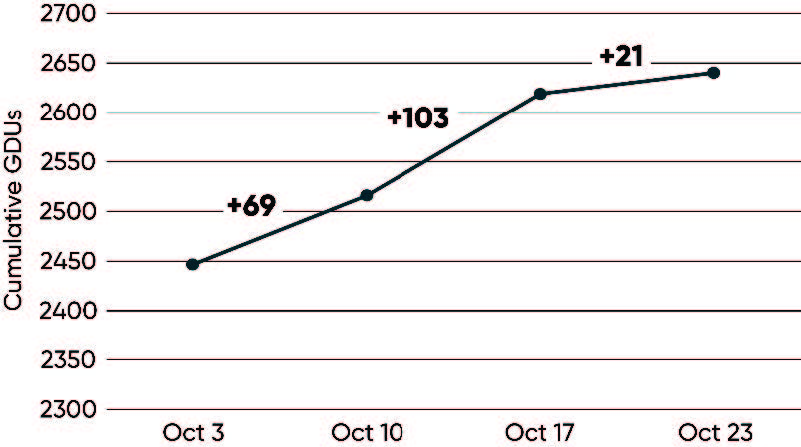
Figure 2. Average cumulative GDUs since planting across trial locations on the four moisture sampling dates.
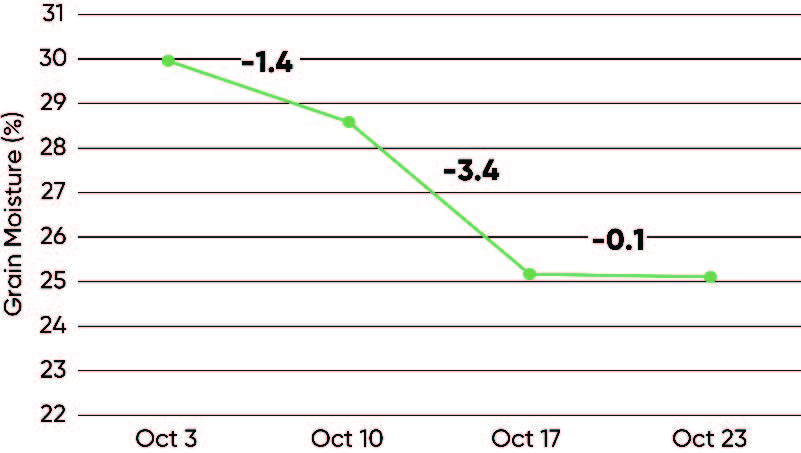
Figure 3. Average grain moisture across all trial locations and hybrids on the four moisture sampling dates.
Hybrid Maturity Effect
- Grain drying dynamics were affected by hybrid CRM.
- Shorter CRM hybrids dried earlier than longer CRM hybrids, as would be expected (Figure 4).
- Average moisture was similar for hybrids ranging from 91-95 CRM, while 96-98 CRM hybrids were consistently wetter over all sampling dates.
- Longer CRM hybrids lost more moisture over the course of the study period, presumably due to the fact that they had more moisture left to lose at the start of the study.
- 91-93 and 94-95 CRM hybrids both lost an average of 4.6 pts of moisture over the study period, while 96-98 CRM hybrids lost an average of 6.2 pts of moisture.
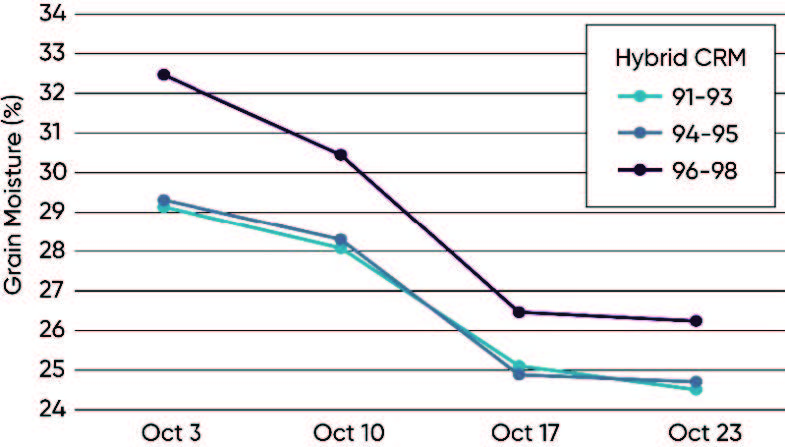
Figure 4. Average grain moisture by hybrid comparative relative maturity (CRM) on the four moisture sampling dates.
Planting Date Effect
- Corn grain dry down timing was influenced by planting date.
- For each week delay in planting, the average moisture of 95 CRM hybrids (which were represented at all 11 trial locations) increased by an average of 1.9 pts on the Oct. 3 sampling date (Figure 5).
- Similar results were observed in a 2020 study in which the average moisture of 93-94 CRM hybrids increased by an average of 1.7 pts for each week of delay in planting (Hermans and Olbach, 2021).
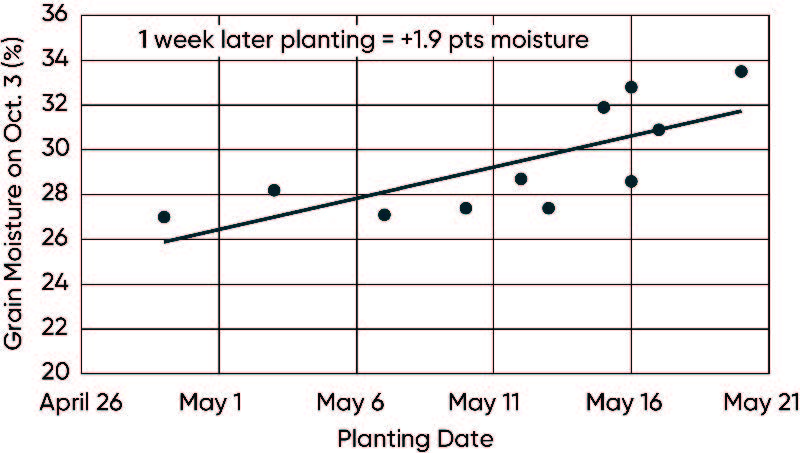
Figure 5. Effect of planting date on average moisture of 95 CRM hybrids measured on October 3 across 11 locations.
References
Hermans, P., and C. Olbach. 2021. Corn maturity and dry down in Ontario. Pioneer Agronomy Research Update. Vol. 11 No. 1.
Thank you to the following Pioneer Sales Agents for their participation in this study:
Martin Besner, Carleton Farm Seed Ltd, Fife Agronomics Ltd, Leeder AgriservicesInc, RumkeAgricultural Services, Rebecca Spuehler, SerAgriInc, and Charles Wert Ag Products Inc.
Authors:
Liam Bracken, Paul Hermans, Tuesday Kristiansen, and Mark Jeschke
December 2021
The foregoing is provided for informational use only. Please contact your Pioneer sales professional for information and suggestions specific to your operation. 2021 data are based on average of all comparisons made in 11 locations through October 23, 2021. Multi-year and multi-location is a better predictor of future performance. Do not use these or any other data from a limited number of trials as a significant factor in product selection. Product responses are variable and subject to a variety of environmental, disease, and pest pressures. Individual results may vary. RU211221