We are performing routine site maintenance Friday Jul 24 (8 am CDT) – Monday Jul 27 (8 am CDT). During this window, account login functionality may be temporarily unavailable. We apologize for any inconvenience.

Country Selector
Africa
Asia Pacific
Europe
Latin America and Caribbean
North America
Please enter a valid location
Corn Maturity and Dry Down in Ontario
Key Findings:
- Trial locations accumulated an average of 104 GDUs over the 3-week study period and lost an average of 7.7 points of grain moisture.
- 88 to 96 CRM hybrids all dried down to within a point of each other, while 98 CRM hybrids were still approximately 4 pts wetter on the final sampling date.
- For each week delay in planting, grain moisture increased by an average of 1.7 pts.
2020 Corn Dry Down Field Research
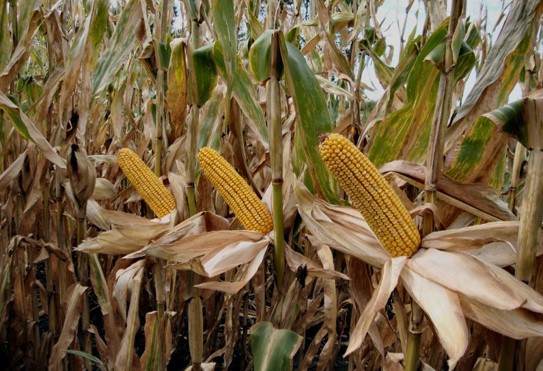
- Corn ear samples were collected from 14 field trial locations to measure the rate of in-field drying prior to harvest in 2020.
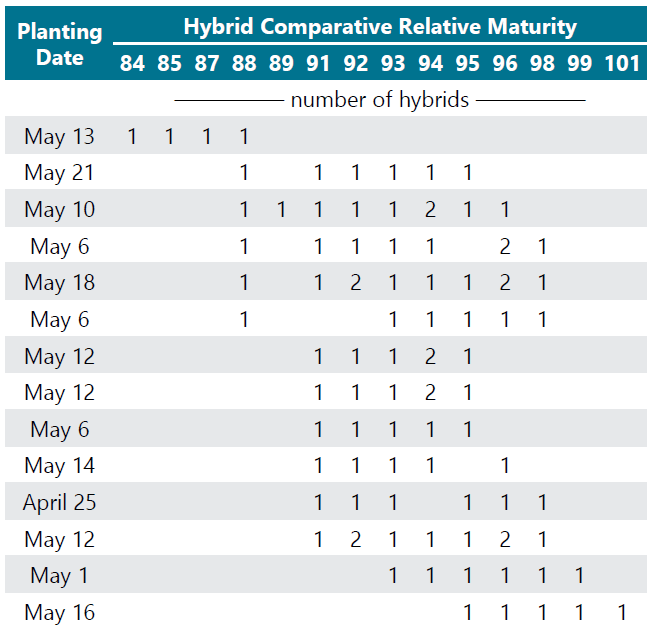
- Each field trial included at least four different hybrids ranging in comparative relative maturity (CRM) from 84 to 101 (Table 1).
- Planting dates of field trials ranged from April 25 to May 21.
- Representative ears were sampled from each hybrid in the trial four times: Sept. 28, Oct. 5, Oct. 13, and Oct. 19.
Table 1. Planting dates and comparative relative maturity of hybrids planted at dry down study locations in 2020.
- Sampled ears were hand-shelled and grain moisture was measured using benchtop moisture testing equipment or a calibrated moisture tester.
- Accumulated growing degree units (GDUs) for each trial location were estimated using the GDU calculator at https://www.pioneer.com/us/tools-services/growing-degree-unit.html
Results
- Trial locations accumulated an average of 104 GDUs over the course of the study period: 40 in week 1, 39 in week 2, and 25 in week 3 (Figure 1).
- Average grain moisture across all locations and hybrids was 30.9% at the start of the study and 23.2% at the end of the study, meaning that grain dried down an average of 1 point per 13.6 GDUs (Figure 2).
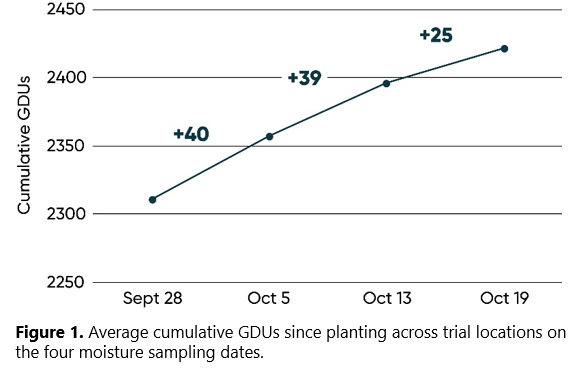
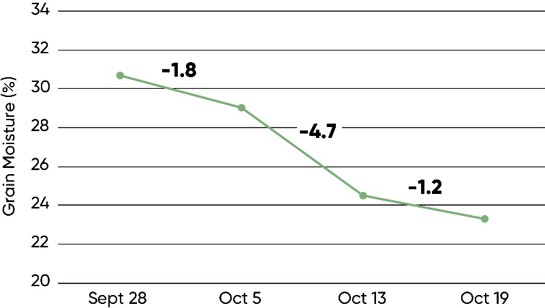
Figure 2. Average grain moisture across all trial locations and hybrids on the four moisture sampling dates.
Grain Moisture (%)
- Average dry down rate was much more rapid during the second week of the study (4.7 pts) than the first week (1.8 pts) even though average GDU accumulation was no greater, illustrating the fact that drying rate is affected by more than just temperature (Figure 2).
- Killing frost timing and above average wind speeds may have contributed to the rapid dry down observed during the second week.
Hybrid Maturity Effect
- Grain drying dynamics were affected by hybrid CRM.
- Shorter CRM hybrids dried earlier than longer CRM hybrids, as would be expected (Figure 3).
- Longer CRM hybrids lost more moisture over the course of the study period, presumably due to the fact that they had more moisture left to lose at the start of the study.
- At the end of the study period, 88 to 96 CRM hybrids had all dried down to within a point of each other, while 98 CRM hybrids still averaged approximately 4 pts wetter.
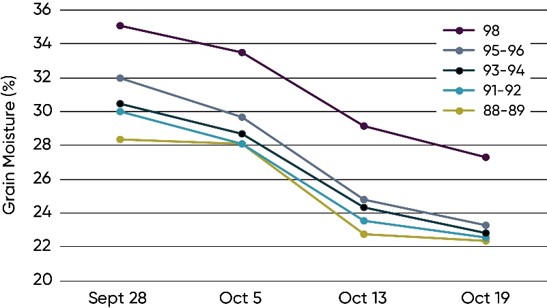
Figure 3. Average grain moisture by hybrid comparative relative maturity (CRM) on the four moisture sampling dates.
Planting Date Effect
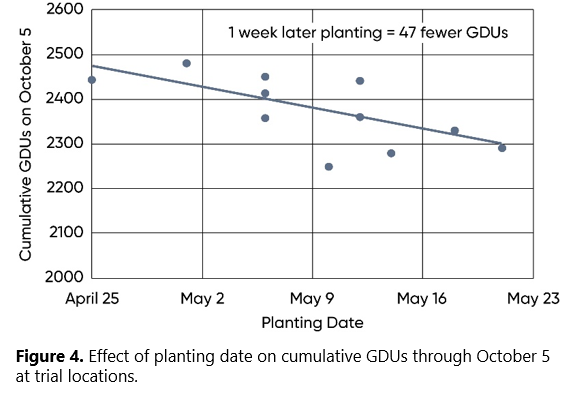
- Total GDU accumulation and corn grain dry down timing were both influenced by planting date.
- Total GDU accumulation was reduced by an average of 47 GDUs for each week delay in planting, (Figure 4).
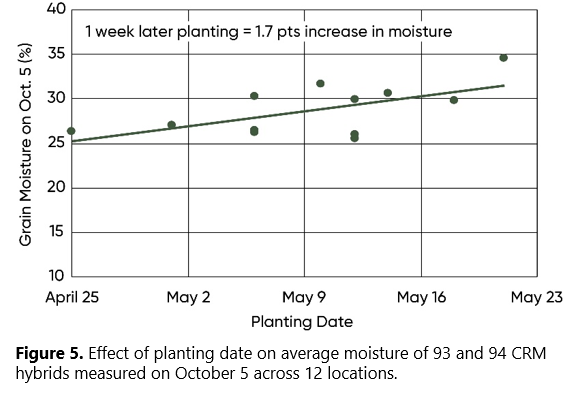
- For each week delay in planting, the average moisture of 93-94 CRM hybrids (which were planted at 12 of the 14 locations) increased by an average of 1.7 pts (Figure 5).
Authors: Paul Hermans and Chris Olbach
February 2021