
Country Selector
Please enter a valid location
Base Saturation and Cation Exchange Capacity
Crop Insights written by Adam Gaspar, Ph.D., Research Scientist
Key Points
- Build and maintain, sufficiency level, and base cation saturation ratio (BCSR) have been the three primary philosophies driving soil fertility recommendation throughout the U.S. concerning positively charged nutrients.
- Base saturation is the sum of base cations (Ca2+, Mg2+, K+, and Na+) held onto the soil exchange sites divided by the total CEC and expressed as a percentage.
- Advocates of the BCSR maintain that there is an approximate ratio of basic cations that must occupy the soil CEC or plant growth will be limited.
- The amount of Ca2+, Mg2+, K+ in the soil can vary considerably depending upon the given soil’s CEC and actual base saturation.
- No “ideal” ratio or range of ratios exists to improve crop production and the BCSR methodology can lead to expensive, non-consistent fertility recommendations.
- Growers should use the build and maintain or sufficiency approach to direct their fertility management as these methodologies have been intensively tested, calibrated, and consider probability of a response.
- Introduction
- Philosophy Behind the BCSR Approach
- Research on the Base Cation Saturation Ratio
- Build and Maintain Approach
- Conclusion
- References
Introduction
Since the 1950s, there have been three philosophies driving soil fertility recommendation throughout the U.S. concerning certain base cations (Ca2+, Mg2+, K+). They include build and maintain; sufficiency level; and base cation saturation ratio (BCSR). The theory of an “ideal” BCSR in the soil has been extensively discussed and used to a limited extent throughout the Midwest by some soil testing labs to guide fertility recommendations. This “ideal” soil was first suggested by researchers from New Jersey in the 1940s (Bear et al., 1945; Bear and Toth, 1948; Hunter, 1949; Prince et al., 1947) and further emphasized by William Albrecht, Professor from the University of Missouri. Their theory built upon work done by Loew and May (1901), which suggested that Ca and Mg should be in a 5:4 ratio for optimal plant growth.
However, this theory has been a subject of great debate in terms of its utility for affecting crop yields and farmer profitability. Numerous studies have found flaws in the BCSR method and showed no proven yield increases, while a greater research base exists supporting the sufficiency and build and maintain approaches (Eckert and McLean, 1981; McLean et al., 1983).
Yet, some consultants and ag retailers still use the BCSR method to guide fertility recommendations. All land-grant university fertility recommendations in the Midwest use a sufficiency or build and maintain approach. This article will discuss the theory behind the BCSR method, its applicability, if there is any value to it, and why state fertility recommendations do not endorse the BCSR method.
Philosophy Behind the BCSR Approach
To understand the theory behind the BCSR method or specifically, the Ca:Mg ratio, one must understand cation exchange capacity (CEC). Cations are positively charged ions in the soil solution (Ca2+, NH4+, Mg2+, K+, Na+, etc.). CEC is defined as the total amount of cations, in milliequivalents (meq), held to soil components through an electrostatic attraction, which can be exchanged with cations in soil solution. A specific soil’s CEC is dependent upon three main factors:
- The amount of clay (soil texture)
- Type of the clay
- Amount of organic matter (OM)
For this reason, the CEC of a given soil can vary from 0 to 50 meq/100g soil. Soils with a low CEC typically have a high sand fraction and low OM content, whereas soils with a high CEC have a relatively high clay fraction and/or OM content (Figure 1).
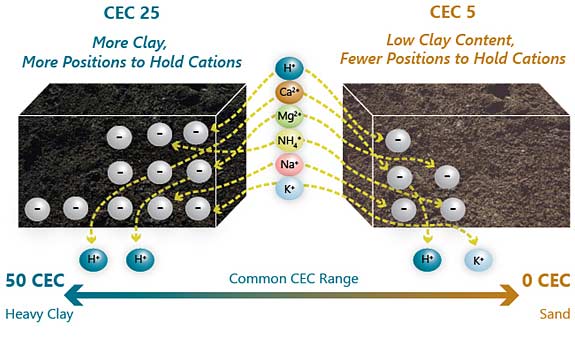
Figure 1. Depiction of the soil CEC. Adapted from Spectrum Analytics Inc.
Further knowledge of base saturation is critical to the BCSR method. Base saturation is the sum of base cations (Ca2+, Mg2+, K+, and Na+) held onto the soil exchange sites divided by the total CEC and expressed as a percentage. Base saturation can be described by Figure 2. For this reason, the amount of cations on the exchange sites will be limited as the soil pH decreases or becomes more acidic due to the increased amount of H+ ions on exchange sites and in soil solution.

Figure 2. Relationship between base saturation and H+ on the CEC across soil pH.
Base Cation Saturation Ratio
Advocates of the BCSR maintain that there is a ratio of basic cations (Ca2+, Mg2+, and K+) that must occupy the soil cation exchange sites or plant growth will be limited. Bear et al. (1945) suggested that the base saturation of the cation exchange complex should be in specific amounts of 65% Ca2+, 10% Mg2+, 5% K+, and 20% a combination of H+, Na+ and NH4+. This results in a base cation saturation ratios of 6.5:1 for Ca:Mg, 13:1 for Ca:K, and 2:1 for Mg:K, which is also expressed as 13:2:1 for Ca:Mg:K and has been termed the “ideal” ratio (Table 1).
Furthermore, Bear and his colleagues mentioned that there is likely a range in the amount of Ca2+, Mg2+, and K+ that can occupy exchange sites and still allow optimal crop growth. However, no such range was ever reported, and therefore, many soil testing labs took these values as absolute with no margin of error. Base saturation ranges were not reported until Graham (1959) did so and again by Baker and Amacher (1981). However, these ranges are completely based upon theory along with the work of Bear and his colleagues and not on actual field or laboratory experiments (Table 1).
Table 1. Previously reported base saturations and subsequent base cation saturation ratios (BCSR) for an “ideal” soil.
 for an 'ideal' soil.")
* Bear et al. (1945) is considered the "ideal" ratio.
The BCSR method focuses on keeping these three nutrients close to specific cationic ratios (Table 1) regardless of soil test values, soil type, crop, and yield potential. However, because the BCSR approach solely focuses on maintaining a specific ratio between Ca2+, Mg2+, and K+ (13:2:1), the amount of these nutrients in the soil can vary considerably depending upon the given soil’s CEC (Table 2) and actual base saturation (Table 4).
Table 2. Comparison of 2 soils with the same base saturations but different CEC and their approximate levels of calcium, magnesium, and potassium in the soil at the “ideal” ratio.

Table 3. Wisconsin soil test categories for calcium, magnesium, and potassium.

*From Laboski and Peters (2012)
Note: Larger View - Table 3.
Table 4. Comparison of two soils with the same CEC and “ideal” ratio of 13:2:1 of Ca:Mg:K but different percent base saturations and their approximate levels of calcium, magnesium, and potassium.

*Both soils are at the “ideal” ratio
Note: Larger View - Table 4.
Table 5. Ca:Mg ratio for various soil types throughout WI.

*From Schulte and Kelling (1985)
Note: Larger View - Table 5.
For example, a soil with a CEC of 5 meq/100g soil will contain approximately 1,300 lb/acre Ca (650 ppm) compared to 10,400 lb/acre Ca (5,200 ppm) in a soil with a CEC of 40 meq/100g, both at the same base saturation of 65% Ca (Table 2). While, these levels of Ca are not detrimental to plant growth, reaching this Ca base saturation for a high CEC soil can require large and expensive fertilizer applications. For instance, if the Ca:Mg ratio is initially 5.5:1 (55% Ca and 10% Mg) and the soil CEC is 40 meq/100g, there is roughly 8,800 lb/acre Ca.
Obviously, a soil with over 4 tons/acre Ca (4,000 ppm) is in excess supply, but the BCSR approach would recommend 3.6 tons/acre of gypsum to bring that soil to the “ideal” ratio of 6.5:1. At $40/ton of gypsum, this would cost approximately $144/acre on soil that is already excessively high for Ca (>1,000 ppm) as conveyed by the build and maintain approach (Table 3).
Another two soils with the same CEC, both at the “ideal” ratio, can have vastly different amounts of Ca, Mg, and K due to different base saturations of the cation exchange complex (Table 4). Displayed in Table 4 are two sandy soils with low CEC that are both at the “ideal” ratio; however, soil #2 with base saturations of 32.5% Ca, 5% Mg, and 2.5% K would contain less than optimal amounts of all three nutrients for crop production. The soil test levels would subsequently be 325 ppm Ca, 30 ppm Mg, and 49 ppm K (Table 3). All three nutrients would fall into the low-end of the low soil test category (Table 3) and, therefore, likely limit crop production even though the soil is at the “ideal” ratio. Furthermore, such a low saturation of the CEC with Ca, Mg, and K would likely lead to a pH well below 6.0 due to high saturation of H+ ions on the exchange sites (Figure 2).
Current recommendations would suggest an application of agricultural or dolomitic lime to correct the pH. Besides raising the pH, the lime application would also move the BCSR away from the “ideal” ratio but actually improves crop production due to a more favorable pH.
Research on the Base Cation Saturation Ratio
Ratios in Wisconsin Soil
The growing environment and soil types vary considerably across Wisconsin. Schulte and Kelling (1985) quantified the Ca:Mg ratio of 17 common soil types throughout Wisconsin and found the ratio ranged from 8.1:1 to 1.0:1 (Table 5). Some of the silt loam soils like Antigo fell near 4:0.1 compared to soils with more clay, like Marathon with a ratio of 7.7:1.
Obviously, the Ca:Mg ratio will vary between soil types, but theory would suggest that the ratio should change after years of producing a crop and subsequently removing various amounts of exchangeable Ca and Mg. However, the effect of cropping was negligible and only decreased the ratio in the Boone loamy soil (Table 6). It was noted that this decrease was a result of reducing the exchangeable Ca (Schulte and Kelling, 1985).
Table 6. Effect of crop production on the Ca:Mg ratio in four WI soils. Adapted from Schulte and Kelling (1985).

†Actual pounds of exchangeable Ca/exchangeable Mg.
Effects of BCSR on Crop Production
Due to the popularity of BCSR fertility recommendations from some commercial soil testing labs, many studies were conducted in the 1970s and 1980s to test this methodology. The results from these studies have shown almost no evidence of a base cation saturation ratio effect on crop yields. In fact, the results from Bear et al. (1945) and Graham (1959) may be more attributed to the changes in soil pH when the base saturation of Ca and Mg was adjusted to 65% and 10%, respectively, rather than the actual ratio.
Liebhardt (1981) showed a direct relationship between soil pH and exchangeable Ca+Mg (Figure 3). Coincidently, the “ideal” ratio corresponds with a pH slightly above 6.0, which is optimum for growth of non-leguminous crops and may explain the increased plant growth reported by Bear et al. (1945), Bear and Toth (1948), Hunter (1949), and Prince et al. (1947).
Furthermore, Liebhardt (1981) reported that there is a wide range of Ca:Mg ratios that will support corn and soybean production given K saturation is not limiting. This agrees with Key et al. (1962), who reported no effect of the Ca:Mg ratio across a CEC range of 3 to 27 meq/100g on corn and soybean yield given the ratio is not below 1.0:1, which is extremely rare in agricultural soils. Furthermore, a study in Ohio evaluated 18 different BCSR combinations over 4 years and their effect on corn and soybean grain yields (McLean et al., 1983). The results of this study identified no relationship between BCSR and grain yield, and no specific “ideal” ratio was found. Actually, there was a wide range of ratios that corresponded to the highest and lowest grain yields each year and are displayed in Table 7.

Figure 3. Soil pH and Ca+Mg relationship. Adapted from Liebhardt (1981).
Simson et al. (1979) also found no effect of the Ca:Mg ratio on corn grain yield and alfalfa dry matter production at four locations throughout Wisconsin where a ratio as low as 1.0:1 was tested. They went on to further suggest that a very wide range of Ca:Mg ratio would support alfalfa and corn production. The same conclusions were found to be true for the Mg:K ratio in an irrigated sandy soil in Nebraska where the BCSR of 10.3:2.5:1.0 was altered up and down by additions of Mg and K but maintained above critical soil test values for crop production (Rehm and Sorensen, 1985). Regardless of any Mg or K application, no effect on grain yield was observed.
Table 7. Range of BCSRs for the five highest and lowest yields for corn and soybeans. Data from McLean et al. (1983), and table adapted from Rehm (1994).

The only plant effect observed when altering the soils BCSR was the relative concentration of Ca, Mg, and K in plant tissue. Rehm and Sorensen (1985) found the Mg concentration of the plant increased as Mg saturation of the CEC increased, but Mg plant tissue concentration actually decreased when K saturation of the CEC increased, which agrees with McLean and Carbonell (1972). Calcium concentrations in alfalfa and corn were also found to increase when the Ca saturation of the CEC increased (Simon et al., 1979). However, even though plant uptake of these various cations (Ca2+, Mg2+, and K+) could be altered by changing the base saturation of the soil’s CEC, no yield increases resulted.
Build and Maintain Approach
Unlike the BCSR, a build and maintain approach builds fertility levels to critical soil test levels by applying fertilizer over multiple years, avoiding a one-time excessively high application rate. Once the critical soil test level is reached based upon the crop rotation and soil type, fertilizer recommendations are then based upon maintenance (annual crop removal), not keeping a specific soil cationic ratio (Laboski and Peters, 2012; Macnack et al., 2013). This concept is best illustrated by Figure 4 where the relative fertilizer application decreases as the soil test level builds.
In addition, the amount of fertilizer targeted at either crop removal or soil building proportionally changes across the soil test categories. For instance, between the Very Low and Optimum categories, a rate that meets crop removal is applied plus a certain amount of fertilizer targeted to build the soil. Within the Optimum soil test category, enough fertilizer is recommended to meet only crop removal. If the soil test level moves above the Optimum category, the fertilizer application includes a reduced rate for crop removal and nothing targeted at soil building. For example, when the soil tests in the High category, the recommendation is ½ of crop removal, and when in the Very High category, only ¼ of crop removal is recommended. This helps maintain profitability when the soil test level is above optimum because yield responses to fertilizer are not as large or frequent in these categories.
In summary, the build and maintain approach directs producers to keep soil test levels - the amount of Ca, Mg, and K - within an optimum range (Table 4) and then continue to fertilize the crop, not the soil, to maximize profitability throughout their crop rotation (Figure 4).

Figure 4. Theory behind a build and maintain fertility recommendation.
Conclusion
In summary, the BCSR approach to soil fertility was developed in the 1940s and is only based upon a handful of studies conducted in the eastern U.S. (Bear et al., 1945; Bear and Toth, 1948; Hunter, 1949; Prince et al., 1947). Unfortunately, it was incorporated into soil fertility recommendation at some soil testing labs during the 1950s and still persists with a few ag retailers throughout the country. Its methodology can lead to expensive, non-consistent recommendations that hold Ca, Mg, and K at very different levels due to a soil CEC and/or base saturation. In many cases, this can result in excessive fertilizer applications or nutrient deficiencies even though the “ideal” ratio is being held. There was considerable work done through the 1970s and 1980s to test the BCSR concept.
The conclusion of all of these studies was that no “ideal” ratio or range of ratios existed to improve crop production and advised that these nutrients should be held in sufficient but not excessive levels instead of aiming for a specific ratio or base saturation (Key et al., 1962; McLean et al., 1983; Moser, 1933; Rehm and Sorensen, 1985; Simson et al., 1979).
In contrast, this article also summarizes the methodology behind the build and maintain soil fertility approach, which is backed by a larger research base with proven yield responses. In addition, this approach includes an economic aspect when creating fertility recommendations. The build and maintain or sufficiency approach is currently recommended by all universities throughout the Midwest and should be used instead of the BCSR approach by growers to employ environmentally and economically sustainable fertility programs.
References
- Baker, D.E. and M.C. Amacher. 1981. The development and interpretation of a diagnostic soil-testing program. Pennsylvania State University Agricultural Experiment Station Bulletin 826. State College, PA.
- Bear, F.E., A.L. Prince, and J.L. Malcolm. 1945. Potassium needs of New Jersey soils. N.J. Agric. Exp. Stn. Bull. No. 71.
- Bear, F.E. and S.J. Toth. 1948. Influence of calcium on availability of other cations. Soil Sci. 65:69-96.
- Graham, E.R. 1959. An explanation of theory and methods of soil testing. Bull. 734. Missouri Agric. Exp. Stn., Columbia.
- Hunter, A.S. 1949. Yield and composition of alfalfa as influenced by variations in the calcium-magnesium ratio. Soil Sci. 67:53-62.
- Key, J.L., L.T. Kurtz, and B.B. Tucker. 1962. Influence of ratio of exchangeable calcium-magnesium on yield and composition of soybeans and corn. Soil Sci. 93:265-270.
- Laboski, C.A.M., and J.B. Peters. 2012. Nutrient application guidelines for field, vegetable, and fruit crops in Wisconsin. Coop. Ext. Serv. A-2809. Univ. of Wisconsin, Madison, WI.
- Liebhardt, W.C. 1981. The basic cation saturation concept and lime and potassium recommendations on Delaware Coastal Plain soils. Soil Sci. Soc. Am. J. 45:544-549.
- Loew, O., and D.W. May. 1901. The relation of lime and magnesia to plant growth. USDA Bur. Of Plant Industries Bull. 1. USDA, Washington, DC.
- Macnack, N., B.K. Chim, B. Amedy, and B. Arnall. 2013. Fertilization based on sufficiency, build-up, and maintenance concept. Coop. Ext. Serv. PSS-2266. Oklahoma State Univ., Stillwater, OK.
- McLean, E.O. and M.D. Carbonell. 1972. Calcium, magnesium, and potassium ratios in two soils and their effects upon yields and nutrient content of German millet and alfalfa. Soil Sci. Soc. Am. Proc. 36:927-930.
- McLean, E.O., R.C. Hartwig, D.J. Eckert, and G.B. Triplett. 1983. Basic cation saturation ratios as a basis for fertilizing and liming agronomic crops. II. Field studies. Agron J. 75:635-639.
- Prince, A.L., M. Zimmerman, and F.E. Bear. 1947. The magnesium supplying power of 20 New Jersey soils. Soil Sci 63:69-78.
- Rehm, G. W. 1994. Soil cation ratios for crop production. Coop. Ext. Serv. 533. Univ. of Minnesota, St. Paul, MN.
- Rehm, G.W. and R.C. Sorensen. 1985. Effects of potassium and magnesium applied for corn grown on an irrigated sandy soil. Soil Sci. Soc. Amer. J. 49:1446-1450.
- Schulte, E.E., and K.A. Kelling. 1985. Soil calcium to magnesium ratios – should you be concerned? Coop. Ext. Serv. G-2986. Univ. of Wisconsin, Madison, WI.
- Simson, C.R., R.B. Corey, and M.E. Sumner. 1979. Effect of varying Ca:Mg ratios on yield and composition of corn and alfalfa. Commun. Soil Sci. and Plant Anal. 10:153-162.
The foregoing is provided for informational use only. Contact your Pioneer sales professional for information and suggestions specific to your operation. Product performance is variable and subject to any number of environmental, disease, and pest pressures. Individual results may vary. Pioneer® brand products are provided subject to the terms and conditions of purchase which are part of the labeling and purchase documents.