
Country Selector
Please enter a valid location
Corn Response to Foliar Inputs in Narrow-Row Systems
Agronomy Research Update from Pioneer Agronomy Sciences as part of the Pioneer Crop Management Research Awards (CMRA) Program.
- Key Findings
- Objectives
- Study Description
- Growing Conditions
- Results
- Conclusions
Key Findings
- Foliar N increased yield in narrow rows, but by just enough to pay for cost of application.
- Fungicide plus foliar N did not increase yield compared with fungicide alone in narrow rows.
- The value of foliar inputs in this study was likely limited due to crop rotations used at the research sites and low foliar disease pressure during the study.
Objectives
- A three-year field study was conducted to determine if disease or nitrogen (N) demands increase in plants grown in narrow rows (15-inch spacing) compared with conventional row spacing (30 inches), and if intensive management involving application of foliar N with or without a fungicide can help increase grain yield in narrow-row systems.
- This research was conducted by Dr. Peter Thomison and Dr. Alex Lindsey, Ohio State University, as a part of the Pioneer Crop Management Research Awards (CMRA) Program.
Study Description
- Years: 2016 to 2018
- Locations:
- Western Agricultural Research Station (WARS); South Charleston, Ohio
- Northwest Agricultural Research Station (NWARS); Custar, Ohio
- Planting Dates:
- May 24 (2016), June 2 (2017), May 9 (2018)
- Previous Crops:
- WARS: Soybean (all years)
- NWARS: Soybean (2016), wheat (2017, 2018)
- Base Nitrogen Program:
- WARS: 180 lbs N/acre applied as anhydrous ammonia
(82-0-0) prior to planting - NWARS: 200 lbs N/acre applied as UAN (28-0-0) prior to planting
- WARS: 180 lbs N/acre applied as anhydrous ammonia
- Seeding Rate: 35,000 seeds/acre
- Experimental Design: Split-plot randomized complete block design; whole plot factor: row spacing; split-plot factor: hybrid and foliar treatment combination
- Hybrid/Brand¹:
- P0843AM™ (AM, LL, RR2)
- P0825AM™ (AM, LL, RR2)
- Row Spacings:
- 15 inches
- 30 inches
- Foliar Treatments (applied at R1 stage):
- Non-treated
- Foliar N (5.9 lbs N/acre, Coron® 28-0-0 Ag)
- Foliar fungicide (DuPont™ Aproach® Prima, 6.8 fl oz/acre)
- Foliar N + foliar fungicide
- Disease severity at and below the ear leaf, ear leaf N content, and ear leaf chlorophyll content were measured at foliar application and 14 days after foliar application for all treatments.
Growing Conditions
- Weather conditions were generally favorable for corn production at both experimental sites over the three years of the study.
- Disease incidence was low (<6% leaf area coverage) across years, resulting in limited disease severity at the R1 stage and during early grain filling.
- Predominant foliar diseases by year:
- 2016: Gray leaf spot, northern corn leaf blight
- 2017: Common rust, gray leaf spot
- 2018: Gray leaf spot
Results
Hybrid Differences
- Hybrid differences were evident for almost every parameter measured; however, the two hybrids responded similarly to management practices.
- Pioneer® P0843AM™ brand corn exhibited less foliar disease than Pioneer® P0825AM™ brand corn and greater ear-leaf N concentrations and SPAD values than P0825AM™.
- Although statistically different, ear-leaf N at the R1 stage was within the normal sufficiency range (2.90-3.50%) for each hybrid.
- Despite having less disease and greater ear-leaf N content, P0843AM™ was lower yielding than P0825AM™
 and row spacing interaction effect on corn yield and partial return.")
Figure 1. Treatment (non-treated vs. foliar N application) and row spacing interaction effect on corn yield and partial return.
Different letters on the chart indicate that the means are different. Partial return calculation based on corn price of $3.80/bu and foliar N application cost of $20.11/acre.
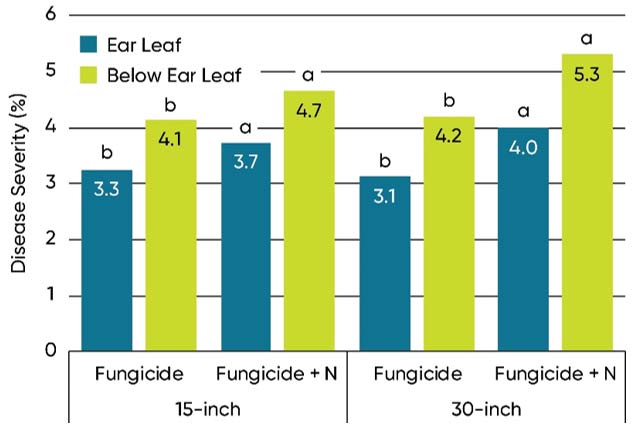
Figure 2. Effects of treatment (fungicide vs. fungicide + foliar N) on disease severity on the ear leaf and below the ear leaf across row spacings.
Different letters on the chart denote the means for the treatment effect are significantly different across row spacings.
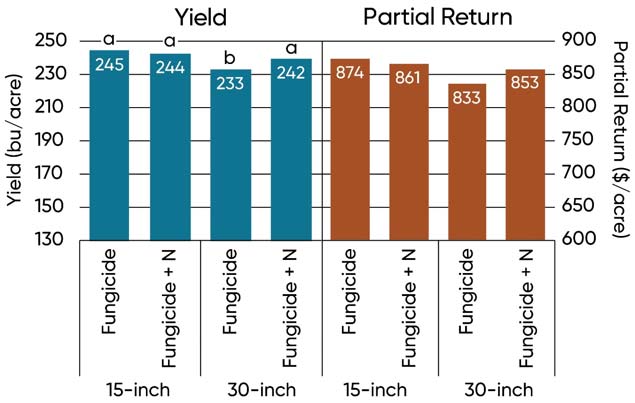
Figure 3. Effects of treatment (fungicide vs. fungicide + foliar N) and row spacing on yield and partial return.
Different letters on the chart denote the means are different for the interaction. The absence of letters denotes the Global F-test was not significant. Partial return calculation based on corn price of $3.80/bu, fungicide application cost of $23.10/acre and fungicide + foliar N cost of $34.10/acre.
Foliar N vs. Non-Treated
- Foliar N increased yield in narrow-row corn by 5.8 bu/acre compared to the non-treated check. This yield gain was just enough to offset the cost of application (Figure 1).
- Foliar N did not increase yield in the 30-inch row corn, and the added cost of application resulted in significantly lower economic return.
- Disease severity 14 days after treatment was not affected by row spacing or by foliar N application.
Fungicide + Foliar N vs. Fungicide Alone
- The inclusion of foliar N with a fungicide treatment resulted in increased disease severity for both the ear-leaf as well as the leaf directly below the ear leaf; however, disease pressure overall was low and did not affect yield (Figure 2).
- Previous research has shown that foliar N application can increase the severity of gray leaf spot, which is consistent with observations in this study.
- The addition of foliar N with the fungicide did not affect yield in narrow-row corn but increased yield by 8.9 bu/acre in 30-inch row corn (Figure 3).
- The average yield increase in 30-inch row corn with the addition of foliar N was more than enough to offset the added cost of the product, although differences in partial return were not statistically significant.
Conclusions
- Results of this study did not show a greater need for additional foliar inputs in narrow-row corn to maximize economic return.
- The value of foliar N and fungicide treatments in this study was likely limited by the low disease pressure and generally favorable growing environments.
- Foliar inputs may more beneficial under conditions conducive to greater disease pressure and nitrogen deficiency stress. Future studies should examine reduced-tillage, continuous corn, and higher population density environments.
Authors: Alex Lindsey, Peter Thomison, Kirk Reese, Allen Geyer, Ashley Richie, Samuel Banks, and Matheus Ogando do Granja
Research conducted by Dr. Peter Thomison and Dr. Alex Lindsey, Ohio State University, as a part of the Pioneer Crop Management Research Awards (CMRA) Program. This program provides funds for agronomic and precision farming studies by university and USDA cooperators throughout North America. The awards extend for up to four years and address crop management information needs of Pioneer agronomists, sales professionals and customers.


AM - Optimum® AcreMax® Insect Protection system with YGCB, HX1, LL, RR2. Contains a single-bag integrated refuge solution for above-ground insects. In EPA-designated cotton growing counties, a 20% separate corn borer refuge must be planted with Optimum AcreMax products. YGCB - The YieldGard® Corn Borer gene offers a high level of resistance to European corn borer, southwestern corn borer and southern cornstalk borer; moderate resistance to corn earworm and common stalk borer; and above average resistance to fall armyworm. HX1 - Contains the Herculex® I Insect Protection gene which provides protection against European corn borer, southwestern corn borer, black cutworm, fall armyworm, lesser corn stalk borer, southern corn stalk borer, and sugarcane borer; and suppresses corn earworm. LL - Contains the LibertyLink® gene for resistance to Liberty® herbicide. RR2 - Contains the Roundup Ready® Corn 2 trait that provides crop safety for over-the-top applications of labeled glyphosate herbicides when applied according to label directions. Herculex® I Insect Protection technology by Dow AgroSciences and Pioneer Hi-Bred. Herculex® and the HX logo are registered trademarks of Dow AgroSciences LLC. Liberty®, LibertyLink® and the Water Droplet Design are registered trademarks of BASF. Roundup Ready® is a registered trademark used under license from Monsanto Company.
The foregoing is provided for informational use only. Please contact your Pioneer sales professional for information and suggestions specific to your operation. 2016-2018 data are based on average of all comparisons made in two locations through Dec. 1, 2018. Multi-year and multi-location is a better predictor of future performance. Do not use these or any other data from a limited number of trials as a significant factor in product selection. Product responses are variable and subject to a variety of environmental, disease, and pest pressures. Individual results may vary. Pioneer® brand products are provided subject to the terms and conditions of purchase which are part of the labeling and purchase documents. ¹All Pioneer products are hybrids unless designated with AM1, AM, AML, AMT, AMRW, AMX, AMXT, and Q in which case they are brands.