
Country Selector
Please enter a valid location
Soybean Maturity Group Considerations at Different Latitudes and Planting Dates
- Rationale and Objectives
- Study Description
- Planting Date
- Maturity Group x Planting Date
- Conclusions
Rationale and Objectives
- Since the 1970’s, the length of the growing season has steadily increased, most notably in the northern Corn Belt where producers are planting soybeans approximately 1 to 3 weeks earlier.
- With earlier planting dates, many producers question what the optimum maturity group (MG) range is to plant in their geographical region to maximize light interception and yield.
- In contrast, some spring planting seasons present challenges, such as prolonged rainfall and equipment logistical problems, which can delay planting. Moreover, less than optimal soybean stands can emerge in some situations due to soil crusting, flooding, insect damage, and seedling diseases, which may require replant or essentially later planting.
- A failure to properly adjust maturity groups to planting date can result in shorter maturities underutilizing the growing season or longer maturities with an increased risk of fall frost damage.
- Therefore, this study aims to discover the proper MG range growers should consider at different planting dates within various latitudinal regions of the northern Corn Belt to maximize yield and avoid fall frost damage.
Study Description
- Environments: 3 years (concluding in 2016) at 3 locations.
- Planting Dates: RCBD with 5 planting dates containing 6 varieties within each planting date, depending upon the location. May 1st, May 20th, June 1st, June 10th, and June 20th.
- Varieties: 2 varieties per MG (14 total Pioneer® brand soybean varieties, MG 00.5 – 2.5)
- Maturity Groups (MG):Arlington, Hancock
PD 1 – 2.5, 2.0, 1.5
PD 2 – 2.5, 2.0, 1.5
PD 3 – 2.0, 1.5, 1.0
PD 4 – 2.0, 1.5, 1.0
PD 5 – 1.5, 1.0, 0.5Spooner
PD 1 – 1.5, 1.0, 0.5
PD 2 – 1.5, 1.0, 0.5
PD 3 – 1.0, 0.5, 0.0
PD 4 – 1.0, 0.5, 0.0
PD 5 – 0.5, 0.0, 00.5Study Locations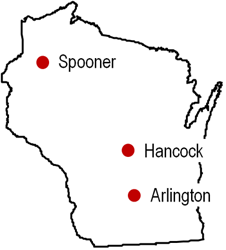
Planting Date


† Comparison of yield decline between years at each location.
‡ Comparison of yield decline between years across locations.
Figure 1. Yield decline as planting is delayed past May 1st across all varieties at each location in 2014 and 2015.
Maturity Group x Planting Date
- At Arlington and Hancock, planting the longest MG resulted in the highest yield within the first four planting dates and was significant (P=0.05) in 7 of 8 instances (Table 1).
- Within the latest planting date (June 20th), planting the shortest MG yielded the highest, but was not significant. Furthermore, the MG 1.5 varieties did not mature before the first fall frost in 2014.
- Therefore, planting a portion of the total soybean acres to a slightly longer MG than normal within May can result in greater yields with no additional dollars spent. In addition, when planting is delayed into June, switching to a variety much more than 0.5 MG earlier than a full season variety (2.5 MG) may limit yield potential. However, if planting is delayed until mid to late June or replanting is needed, growers should utilize varieties at least a full MG earlier.
Table 1. Planting date x maturity group interaction for each location, combined across 2014 and 2015.

*The highest yielding maturity group is listed for each planting date within each location.
*Those planting date by location combinations highlighted in green showed significantly higher yields for that MG compared to the other maturity groups tested at the 5% significance level.
- At Spooner, MG selection was not as critical and only the latest planting date (June 20th) saw a significant effect of MG on yield where the 0.5 MG out yielded the 0.0 and ultra-early 00.5 MG varieties.
- Therefore, northern WI growers may maximize yield and avoid fall frost damage using varieties within a narrower MG range (1.0 to 0.5).
Conclusions
- On average, soybean yield declined by 0.36 bu/acre/day when planting was delayed past early May, while specific estimates of yield loss were more associated with the location instead of year.
- Regardless, producers should aim to begin soybean planting as soon as the soil is fit, soil temps are nearing 50 ˚F, and the forecast is favorable.
- Variety selection heavily based upon the MG is not a simple solution to increase yields, however it does provide the “potential” for higher yields, with no additional dollars spent.
- This potential was realized consistently within the southern locations.
- Therefore, growers should give consideration to the MG when selecting varieties, but past local and regional performance, disease packages, SCN-resistance, etc. should take precedence.
- In addition, harvest timing and logistics should also be considered to optimize harvest efficiency.
Research conducted by Adam Gaspar and Shawn Conley, University of Wisconsin-Madison as a part of the Pioneer Crop Management Research Awards (CMRA) Program. This program provides funds for agronomic and precision farming studies by university and USDA cooperators throughout North America. The awards extend for up to four years and address crop management information needs of Pioneer agronomists, Pioneer sales professionals and customers.
The foregoing is provided for informational use only. Please contact your Pioneer sales professional for information and suggestions specific to your operation. Data are based on average of all comparisons made in six environments from 2014-2015. Multi-year and multi-location is a better predictor of future performance. Do not use these or any other data from a limited number of trials as a significant factor in product selection. Product responses are variable and subject to a variety of environmental, disease, and pest pressures. Individual results may vary.