8/22/2023

How Kernel Weight Varies by Hybrid in Iowa

Something went wrong. Please try again later...
How Kernel Weight Varies by Hybrid in Iowa

Agronomy Research Update
From Pioneer Agronomy Sciences - Ryan Van Roekel, Ph.D.; Dennis Holland; Alex Woodall; Bill Long; Matt Vandehaar; Nate LeVan; Jason Kienast, Lucas Borrás, Ph.D.; Kurt Eischeid


Key Findings

  • Kernel weight is a key component of grain yield that can vary by hybrid and be affected by environmental conditions and management practices.
  • A 7-year field study found that kernel weight can vary widely due to differences in growing conditions (from 52,000 to 137,000 kernels/bu) but that certain hybrid families consistently have higher or lower kernel weights than average.
  • These estimates for kernel weight by hybrid family can be useful for yield estimation, management decisions, and diagnosing yield results that differ from expectations.

Background

  • Corn grain yield is related to the number of kernels per acre and the weight of those kernels.
  • Kernel number is generally regarded as the most important component in determining yield and the most responsive component to environment and management.
  • However, large variations in observed kernel weights suggest that this yield component can also have a large effect on yield.
  • Kernel weight is considered a heritable trait and is known to vary between hybrid families.
  • Kernel weight at harvest can be affected by the crop’s ability to set a high potential kernel weight in the weeks immediately following silking, and its capacity to reach that potential during the grain fill period.
  • Corn has a limited ability to increase kernel weights once the potential has been set (unlike soybean) so it is important to maximize potential kernel weight.
  • To achieve big kernels at harvest, favorable management and conditions are required within the first 20 days after silking in order to set a large potential kernel weight, followed by favorable conditions during grain fill that will allow the corn to reach that full potential. 
  • When late season stresses occur, corn is very sensitive to grain fill stress due to its relatively limited ability to remobilize resources to fill kernels compared to other crops like soybean and wheat.
  • As such, it is common for a late season drought or nutrient deficiency to reduce kernel weights at harvest, even for hybrids that normally have large kernels or when conditions were favorable to set a high kernel weight potential soon after pollination.

Yield Estimation Considerations

  • Corn grain yield can be estimated in-field based on estimates of yield components: ears per acre, kernels per ear, and kernel weight.
  • The first two components are relatively straightforward to estimate – conducting several stand counts of 1/1000th of an acre can provide an estimate of ears per acre and kernel counts can be used to estimate kernels per ear.
  • Furthermore, new technology has greatly improved the speed and accuracy of estimating ears per acre:
    • UAV imagery powered by DroneDeploy can provide field-wide stand counts.
    • The Vegetation Index from satellite imagery in Granular Insights can be used to guide sampling according to field variability to get a better estimate of whole-field yield.
  • However, estimating the third yield component, kernel weight, remains challenging.
  • A common practice is to assume 90,000 kernels/bushel, but this practice often underestimates yield and does not consider differences among hybrids or environments.
  • While work is underway to develop a more reliable way to estimate kernel weights, research was undertaken to characterize common hybrid families in local plots to provide an estimate as to how genetics influence kernels weights under normal management to provide more accurate yield estimates.
  • Additionally, knowing a hybrid’s expected kernel weight can help with understanding the yield impact of late-season management or environmental issues that may prevent a hybrid from reaching its normal kernel weight.

Representative kernels from the middle of an ear from hybrid families with above average and below average kernel weight.

Figure 1. Representative kernels from the middle of an ear from hybrid families with above-average (P1197) and below-average (P1082) kernel weight. Photo courtesy of Bill Long in 2019.

Study Description

  • Kernel weight data was collected from a selection of plots across Iowa from 2016-2022.
  • Kernel weights for each hybrid at a location were measured in one of two ways:
    • A subsample of 100 random kernels, or more, were weighed and corrected to 15% moisture.
    • Multiple stand, ear, and kernel counts were performed prior to harvest to provide a reasonably accurate estimate of ears per acre and kernels per ear. This data was divided by the hybrid’s yield at 15% to determine kernels per bushel.
  • Both methods have limitations, but hybrid trends were consistent, and the datasets were combined to increase the number of locations.
  • A location average kernel weight was calculated from the average of all hybrids at each plot location.
  • To account for environmental differences between locations, a relative kernel weight for each hybrid within a location was calculated as a percentage of the location average. Those percentages were then averaged by hybrid family over all plot locations, as shown in Table 1.
  • The standardized kernels per bushel in Table 1 were calculated as 80,000 kernels/bu divided by the relative kernel weight percentage to provide a reasonable estimate for kernels/bu by hybrid family. This value is not the actual mean of the observed kernels/bu because the dataset is unbalanced for locations between hybrids. As such caution should be used with these results.

Video: What Is Black Layer and What Is It Telling Me?

Results

  • Kernel weight (kernels/bu) was found to vary widely by hybrid, location and yield level.
  • The grand mean of all kernel weight observations was 83,588 kernels/bu but ranged from 52,192 to 136,518 kernels/bu. Grain yield averaged 224.6 bu/ac with a range from 116.2 to 317.0 bu/acre.
  • Individual hybrids also had a wide range in kernel weights between locations. For example, the P1197 family ranged from a high of 54,656 kernels/bu down to 115,749 kernels/bu. However, across all locations, its kernel weight averaged 105.7% of the location average.
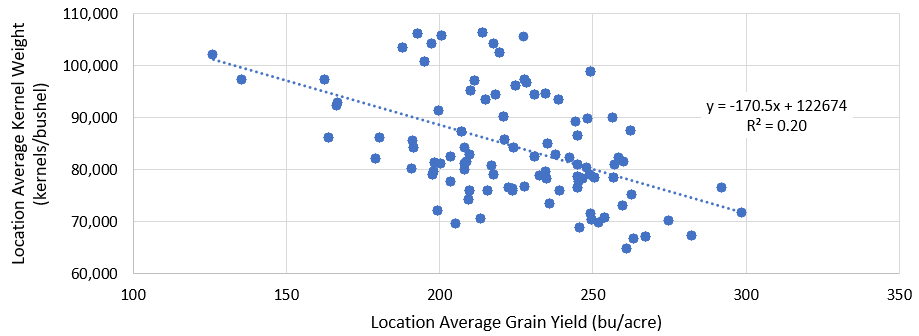
  • On average, there was a trend for higher yields to be associated with higher kernel weights (Figure 2).

Kernel weight as compared to grain yield on average by location.

Figure 2. Kernel weight as compared to grain yield on average by location. Click here or on the image above for a larger view.

Discussion

  • With the wide variation in observed kernel weights between hybrids and locations, it is important to exercise caution when using the standardized kernels/bu shown in Table 1.
    • Environmental and management factors can and will greatly influence a hybrid’s ability to maintain its grain fill and express its full kernel weight potential.
      • For example, the location average kernel weight in 2020 was 85,962 kernels/bu due to late-season drought conditions compared to 2019 at 76,950 kernels/bu with more favorable weather.
    • Often issues like drought, disease pressure, or nitrogen deficiencies can hinder late season plant health and limit a hybrid’s grain fill period and resulting kernel weight.
    • When ignoring hybrid interactions and comparing location average kernels/bu to average yield, a correlation was observed where higher yield plots had higher kernel weights (Figure 2).
    • The variation in kernel weight compared to yield could be due to the size of the potential kernel weight determined soon after pollination, or the fulfillment of that potential later in grain fill.
      • For example, there is a wide range in average kernel weights for plots that had an average yield near 200 bu/acre.
      • The 200 bu/acre plots with 70,000 kernels/bu were likely near their maximum potential kernel weight, while plots with 105,000 kernels/bu likely had late season stress that prevented them from living up to their potential.
      • Within each of these plots, some hybrids had differing trends for maintaining kernel weight with stress or increasing kernel weight with more favorable conditions, likely by setting a higher potential kernel weight.
    • Future work will attempt to document potential kernel weights and then observe their fulfillment by hybrid in differing locations.
  • It is important to note that high kernel weights are not always required for high yields, especially for some hybrids.
    • P1366 is an example of a hybrid family with below average kernel weight that is capable of very high yields (up to 313.9 bu/acre in this study).
    • P1366 tends to achieve high yields through kernel number (more rows around and/or ear length) vs hybrid families like P1197, which tends to have kernel numbers closer to average but high kernel weights.
  • Also note that kernel weight is not correlated with test weight. Test weight is the weight of a volumetric bushel, while kernel weight is a measure of how many kernels are in a 56 lb bushel.
    • An example of this distinction is the P1093 hybrid family, which has very high test weight with excellent grain quality but its high-density kernels tend to be smaller in size and thus weigh less per kernel.
  • When estimating yields, it is best to stick with an average kernel weight estimate of 80,000 kernels/bu for most hybrids.
    • Consider using a lower kernels/bu (i.e., 75,000) for hybrid families like P1197 & P1587 and higher kernels/bu (i.e., 90,000) for hybrid families like P9492 & P1093.
    • If late-season growing conditions are excellent, using a factor of 70,000 kernels/bu may be more appropriate.
    • Conversely, if late-season conditions are poor, a factor of 100,000 kernels/bu might be more accurate.
    • Be sure to get multiple, accurate estimates of kernels/ear and ears/acre to avoid overestimating yield.

    Table 1. Kernel weight as a percentage and standardized kernels/bu by hybrid family.

    Hybrid Family Relative Kernel Weight
    (% of Loc. Mean)¹
    Standardized
    Kernels per Bushel²
    # Loc.
    P9492 91.0 88,000 4
    P9823 98.7 81,000 13
    P9955 101.5 79,000 9
    P0075 101.9 78,500 44
    P0220 102.6 78,000 44
    P0339 105.5 76,000 47
    P0404 102.4 78,000 19
    P0421 104.6 76,500 45
    P0529 95.9 83,500 14
    P0589 103.4 77,500 43
    Hybrid Family Relative Kernel Weight
    (% of Loc. Mean)¹
    Standardized
    Kernels per Bushel²
    # Loc.
    P0622 102.2 78,500 51
    P0688 94.5 84,500 56
    P0720 104.2 77,000 9
    P0859 99.6 80,500 19
    P0924 103.8 77,000 28
    P0953 102.1 78,500 38
    P0977 102.8 78,000 30
    P0995 98.4 81,500 10
    P1027 101.0 79,000 16
    P1082 97.8 82,000 59
    Hybrid Family Relative Kernel Weight
    (% of Loc. Mean)¹
    Standardized
    Kernels per Bushel²
    # Loc.
    P1093 90.1 89,000 62
    P1108 101.8 78,500 31
    P1164 97.6 82,000 20
    P1170 98.5 81,000 7
    P1185 96.6 83,000 72
    P1197 105.7 75,500 61
    P1213 103.5 77,500 26
    P1222 101.0 79,000 17
    P1244 95.1 84,000 24
    P1353 97.1 82,500 31
    Hybrid Family Relative Kernel Weight
    (% of Loc. Mean)¹
    Standardized
    Kernels per Bushel²
    # Loc.
    P1359 103.8 77,000 13
    P1366 96.1 83,000 93
    P1380 100.9 79,500 18
    P1413 99.6 80,500 8
    P1563 97.4 82,000 17
    P1587 109.3 73,000 18
    P1608 101.9 78,500 8
    P1742 105.9 75,500 8

    ¹Calculated as hybrid kernels per bushel compared to the location average kernels per bushel, then averaged over all locations.

    ²Calculated as the kernel weight percentage applied to a “normal” value of 80,000 kernels per bushel, rounded to the nearest 500.

Conclusions

  • Kernel weight is a key component of corn grain yield that varies greatly by hybrid and environment.
  • Having an idea of a hybrid’s normal kernel weight can be useful for more accurate yield estimates.
  • This knowledge also helps provide an understanding of how a hybrid makes its yield (kernel number vs kernel weight), which can be useful when making management decisions or when diagnosing yield results that differ from expectations.

Cornfield - midsummer

Estimate Your Corn Yield

Use this free tool to estimate your yields prior to harvest.

Use Tool


The foregoing is provided for informational use only. Please contact your Pioneer sales professional for information and suggestions specific to your operation. 2016-2022 data are based on average of all comparisons made in over 104 locations through Dec. 30, 2022. Multi-year and multi-location is a better predictor of future performance. Do not use these or any other data from a limited number of trials as a significant factor in product selection. Product responses are variable and subject to a variety of environmental, disease, and pest pressures. Individual results may vary. Pioneer® brand products are provided subject to the terms and conditions of purchase which are part of the labeling and purchase documents.