Soil Test Phosphorus and Potassium Levels in the Corn Belt

Background and Objectives

  • Balanced soil fertility management is critical for achieving crop genetic yield potential and maximizing profitability.
  • Recent evidence suggests that P and K fertilizer rates in some areas may not be keeping pace with increasing crop yields that are accompanied by higher nutrient removal.
  • The objective of this study was to assess soil fertility levels in Pioneer GrowingPoint Agronomy on-farm corn research trials and fields enrolled in EncircaSM Yield services in the Corn Belt.

Study Description

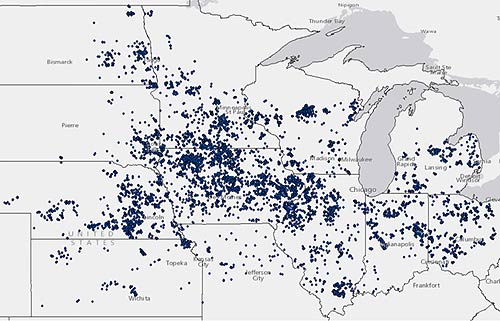
  • DuPont Pioneer agronomists and Encirca certified services agents collected soil samples from 8,925 fields in 12 Corn Belt states between fall 2015 and spring 2016.
  • Soil samples were submitted to Waypoint Analytical for P and K analysis and test results were compared to University fertility recommendations to determine the percent of samples that fell below state optimum levels.
Distribution of the 8,925 fields from which soil samples were collected between fall 2015 and spring 2016 to assess Corn Belt P and K fertility levels.

Figure 1. Distribution of the 8,925 fields from which soil samples were collected between fall 2015 and spring 2016 to assess Corn Belt P and K fertility levels.

Results

Phosphorus Deficient Soils

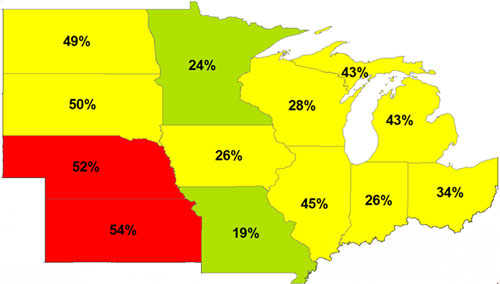
Percent of soil samples that fell below state optimum levels for P in the Corn Belt.

Figure 2. Percent of soil samples that fell below state optimum levels for P in the Corn Belt.

  • Phosphorus deficiency was prevalent throughout the Corn Belt, with the greatest frequency of deficient soils observed in western Corn Belt states.

Potassium Deficient Soils

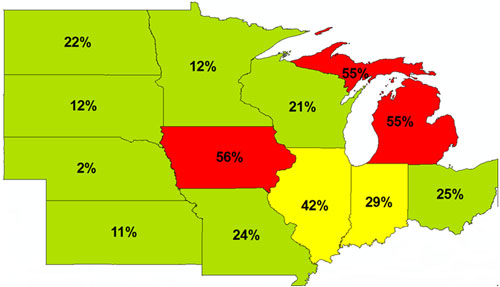
Percent of soil samples that fell below state optimum levels for K in the Corn Belt.

Figure 3. Percent of soil samples that fell below state optimum levels for K in the Corn Belt.

  • Potassium deficiency was most frequently observed in the central Corn Belt and Michigan. Note that university-recommended optimum K levels are significantly higher in Iowa compared to other states in the region.

Authors: Marissah Schulte and Andy Heggenstaller

The foregoing is provided for informational use only. Please contact your Pioneer sales professional for information and suggestions specific to your operation. Results are based on observations made at 8,925 locations through June 30, 2016. Multi-year and multi-location is a better predictor of future performance. Do not use these or any other data from a limited number of trials as a significant factor in product selection. Product responses are variable and subject to a variety of environmental, disease, and pest pressures. Individual results may vary.

Encirca® services are provided subject to the terms and conditions of purchase which are part of the purchase documents.

Encirca® services provides estimates and management suggestions based on statistical and agronomic models. Encirca services is not a substitute for sound field monitoring and management practices. Individual results may vary and are subject to a variety of factors, including weather, disease and pest pressure, soil type and management practices.

ENCIRCA® SERVICES ARE PROVIDED "AS IS" AND PIONEER MAKES NO REPRESENTATION OR WARRANTY, EXPRESS OR IMPLIED, CONCERNING THE USE OF ENCIRCA SERVICES OR THE RESULTS OBTAINED THEREFROM, INCLUDING WITHOUT LIMITATION IMPLIED WARRANTIES OF MERCHANTABILITY OR FITNESS FOR A PARTICULAR PURPOSE, WHICH ARE HEREBY DISCLAIMED. IN NO EVENT WILL PIONEER OR ITS AFFILIATES BE LIABLE TO YOU OR ANY OTHER PERSON FOR ANY LOSS OR DAMAGE RELATING TO YOUR USE OF OR RELIANCE UPON ENCIRCA SERVICES.

®, ™, SM Trademarks and service marks of DuPont, Dow AgroSciences or Pioneer, and their affiliated companies or their respective owners. © 2018 PHII.