
Country Selector
Please enter a valid location
7 Management Practices for 300 bu/acre Yields in Corn
By Mark Jeschke, Ph.D., Agronomy Manager, Pioneer Agronomy Sciences

The Secret to Breaking 300 bu/Acre
Looking to break 300 bu/A? While we don’t have ALL of the answers, we do have some tips and tricks that will get you closer to those grain bin-busting numbers come harvest time! (01:12)
The Secret to Breaking 300 bu/Acre
Looking to break 300 bu/A? While we don’t have ALL of the answers, we do have some tips and tricks that will get you closer to those grain bin-busting numbers come harvest time! (01:12)
- 1. Hybrid Selection
- 2. Crop Rotation
- 3. Plant Population
- 4. Row Spacing
- 5. Planting Date
- 6. Nitrogen Management
- 7. Micronutrients
- 2020 NCGA Corn Yield Contest Results
1. Hybrid Selection
- Selecting the right hybrid is likely the most important management decision of all those made by contest winners.
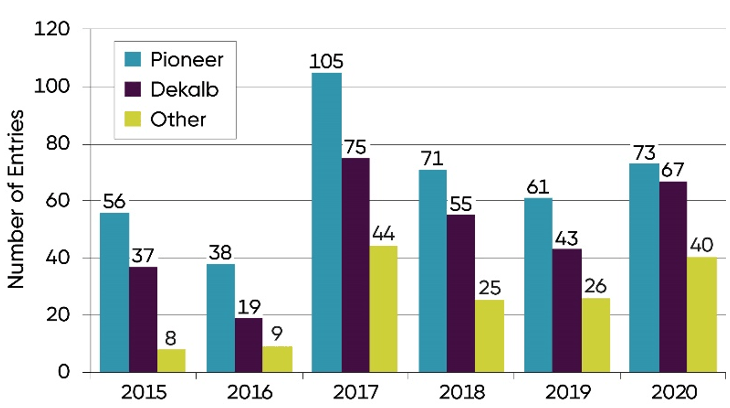
Figure 1. Seed brand planted in NCGA National Corn Yield Contest entries exceeding 300 bu/acre, 2015-2020.
- Maximizing yield requires matching hybrid characteristics with field attributes such as moisture supplying capacity, maturity zone, residue cover and even seedbed temperature.
- Pioneer® brand products were used in more entries exceeding 300 bu/acre than any other individual seed brand in each of the last five years (Figure 1).
2. Crop Rotation
- Most 300 bu/acre entries were planted to a crop other than corn the previous growing season (Figure 2).
- Rotated corn is generally better able to tolerate yield-limiting stress than continuous corn; however, yield contest results show that high yields can be achieved in continuous corn production.
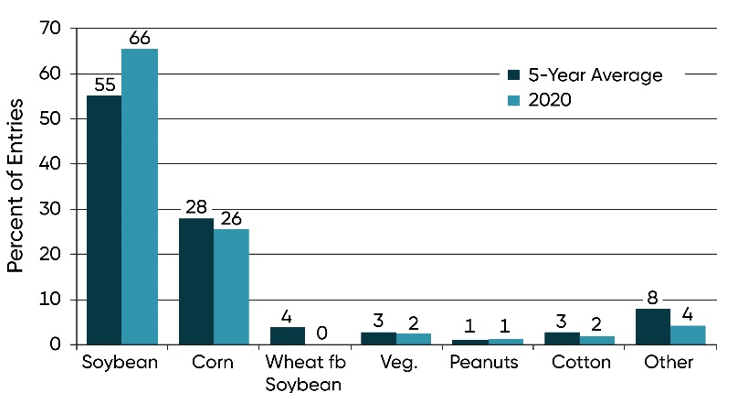
Figure 2. Previous crop in NCGA National Corn Yield Contest entries exceeding 300 bu/acre in 2020 and 5-year averages.
3. Plant Population
- Harvest populations ranged from under 30,000 to over 50,000 plants/acre, but the majority of plots were between 32,000 and 42,000 plants/acre (Figure 3).
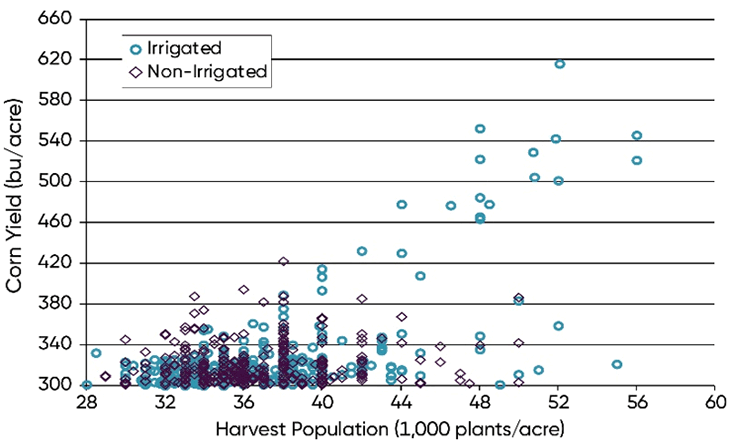
Figure 3. Harvest populations and corn yield NCGA National Corn Yield Contest entries exceeding 300 bu/acre, 2016-2020.
4. Row Spacing
- Row spacing practices in high-yield National Corn Yield Contest entries reflect those used more broadly in U.S. corn production, with a majority of high-yield entries planted in 30-inch rows.
- Row spacings narrower than 30 inches have been a source of continuing interest as a way to achieve greater yields, but adoption has not increased among high-yield contest entries.
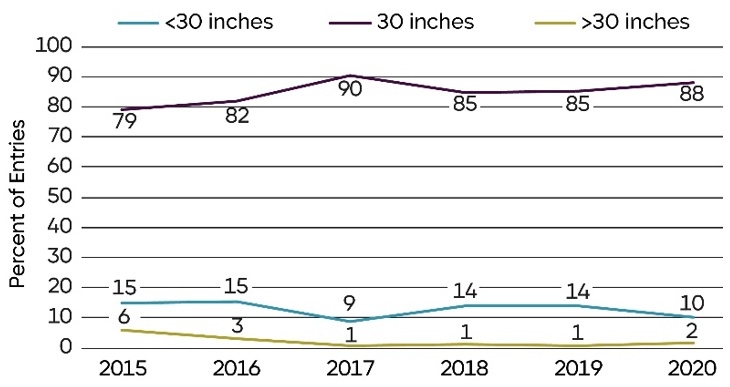
Figure 4. Row spacing used in NCGA National Corn Yield Contest entries exceeding 300 bu/acre, 2015-2020.
5. Planting Date
- High-yielding contest plots are usually planted as early as practical for their geography. Early planting lengthens the growing season and moves pollination earlier, reducing the effects of heat and moisture stress.
- Planting dates for entries exceeding 300 bu/acre ranged from March 15 to June 3 in 2020. Mid-April to early-May planting dates have typically been the most common for high-yields in the central Corn Belt.
- The 2020 contest had several high-yield entries planted in mid- to late-May demonstrating that high yields can still be achieved under favorable conditions if planting is not delayed for too long.
6. Nitrogen Management
- Corn grain removes approximately 0.67 lbs of nitrogen per bushel harvested, and stover production requires about 0.45 lbs of nitrogen for each bushel of grain produced.
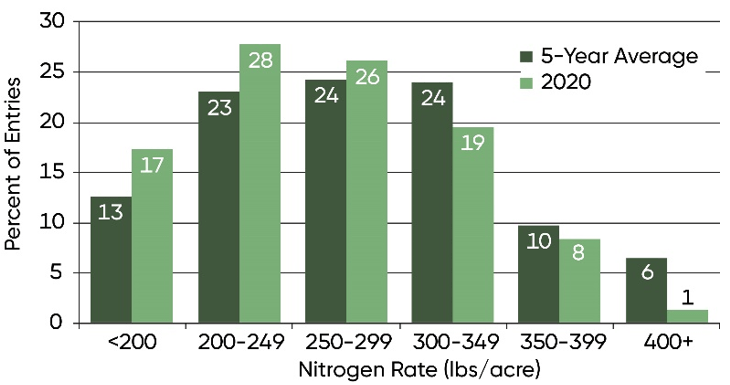
Figure 5. Nitrogen rates (total lbs/acre N applied) of NCGA National Corn Yield Contest entries exceeding 300 bu/acre in 2020 and 5-year averages.
- This means that the total N needed for a 300 bu/acre corn crop is around 336 lbs/acre.
- Only a portion of this amount needs to be supplied by N fertilizer; N is also supplied by the soil through mineralization of soil organic matter.
- The N application rates of 300 bu/acre entries varied greatly; over half were in the range of 200 to 300 lbs/acre (Figure 5).
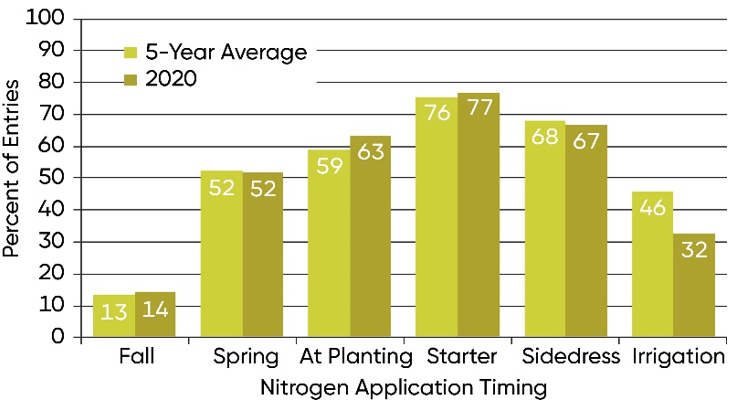
Figure 6. Nitrogen fertilizer application timing of NCGA National Corn Yield Contest entries exceeding 300 bu/acre in 2020 and 5-year averages.
- Timing of N fertilizer applications can be just as important as application rate. The less time there is between N application and crop uptake, the less likely N loss from the soil will limit crop yield (Figure 6).
- Nearly 90% of 300 bu/acre entries in 2020 included some form of in-season N application, either sidedressed or applied with irrigation.
7. Micronutrients
- Micronutrients were applied on nearly half of the 300 bu/acre entries (Figure 7). The nutrients most commonly applied were sulfur (S) and zinc (Zn), with some entries including boron (B), magnesium (Mg), manganese (Mn), or copper (Cu).
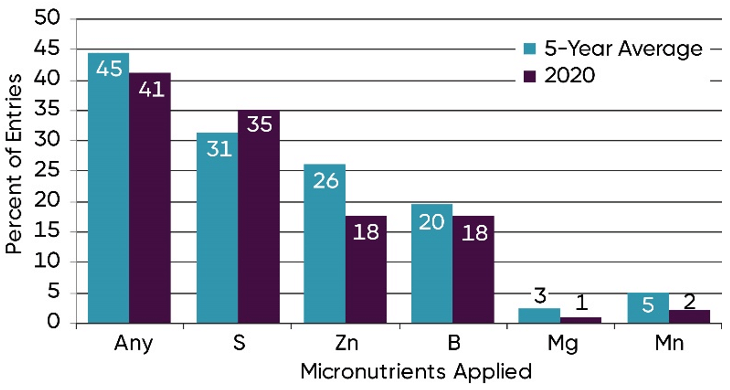
Figure 7. Micronutrients applied in NCGA National Corn Yield Contest entries exceeding 300 bu/acre in 2020 and 5-year averages.
2020 NCGA Corn Yield Contest Results
- The National Corn Growers Association (NCGA) National Corn Yield Contest provides a benchmark for yields that are attainable under optimal conditions and management.
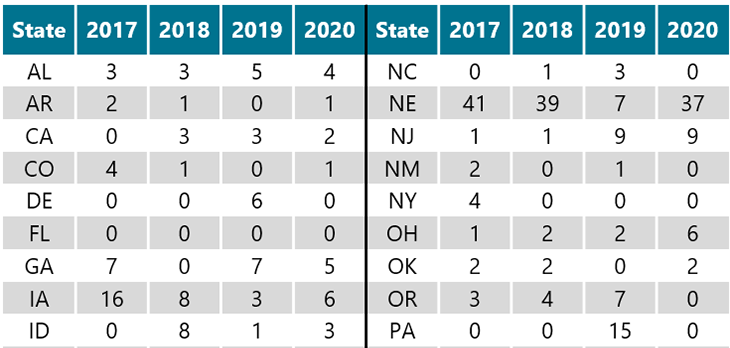
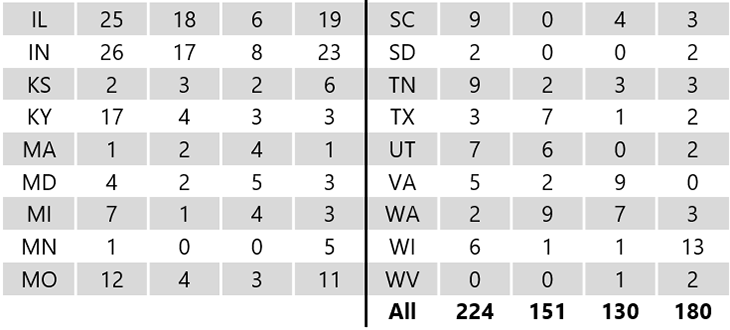
- The 2020 contest had 180 entries that exceeded 300 bu/acre; an increase over the 130 entries in 2019 (Table 1).
- Growers can learn from the practices used in these high-yield entries to improve their own yields.
Table 1. Locations of NCGA National Corn Yield Contest entries over 300 bu/acre in 2017, 2018, 2019, and 2020.
Proven Performance
Pioneer has been leading hybrid corn development since 1920. And is just getting started.


The foregoing is provided for informational use only. Please contact your Pioneer sales professional for information and suggestions specific to your operation. Product performance is variable and depends on many factors such as moisture and heat stress, soil type, management practices and environmental stress as well as disease and pest pressures. Individual results may vary.