
Country Selector
Please enter a valid location
12/5/2025
Plenish® Full-Fat Soybean Meal Roasting & Processing Survey

Dann Bolinger, M.S., Pioneer Dairy Specialist
Shared from Inside the ZONE® newsletter, Pioneer Nutritional Sciences
Key Points
- Plenish® full-fat soybean meal (FFSBM) oleic content is very stable with mean of 77.4% (SD =1.3) of total fatty acids (TFA).
- Notable variation in Plenish FFSBM roasting efficacy and particle size suggests a need for improved quality control.
- Protein Dispersion Index (PDI), as a measure of roasting efficacy, is accurate across a population of samples, but less reliable for evaluating individual samples.
- PDI<14 is a reasonable target for adequate heat treatment relative to rumen undegraded protein (RUP) and urease activity.
- Mean particle size (MPS) of Plenish FFSBM <1,000µm is associated with more desireable fecal fat levels, especially when milk yield ≥90 lbs/cow/day. Range in particle size may also be favorable to support sustained release of fatty acids in the rumen.

- Introduction
- Survey Design
- Herd Observations & Nutritional Composition
- Roasting Efficacy
- Reducing Particle Size
- Recommendations
Introduction
Adoption of high oleic Plenish FFSBM is rapidly growing across the U.S. Most recommendations and research pertaining to roasting and feeding full-fat soybeans are circa the late 1900s. Modern dairy cows have different, typically greater, nutritional needs associated with today’s higher levels of performance. With numerous centralized and on-farm processers of Plenish FFSBM, roasting practices and particle size reduction are not standardized. A survey of Michigan and Ohio dairy farms was conducted to quantify the variation in Plenish FFSBM as well as identify best practices associated with Plenish soybean processing.
Survey Design
Samples and herd information was collected during June 2025 from Holstein or Holstein-crossbred dairy herds (n=19) with established history of feeding Plenish FFSBM.
Samples collected and analyzed as follows:
Plenish FFSBM (Dairyland Labs, Inc.)
- Complete nutritional analyses (NIR)
- Particle Size
- Fatty Acid profile (wet chemistry)
- Protein Dispersion Index (PDI) & urease activity
- Rumen Undegraded Protein (Ross assay)
High Production Group TMR (Dairyland Labs, Inc.)
- Complete nutritional analyses (NIR)
- Fatty Acid profile (wet chemistry)
High Production Group Feces (Rock River Laboratory, Inc.)
- Fecal fat analysis (wet chemistry)
Herd Observations & Nutritional Composition
Surveyed herds’ milk yield (MY) averages above the industry mean, while milk fat and protein composition are comparable to current industry means (Table 1). Inclusion rates of Plenish FFSBM and palmitic fat were not well correlated with milk yield, fat and protein (±r≤0.3).
Table 1. Herd TMR inclusions and average milk production (n=19)
| Plenish FFSBM lbs/c/d | Palm Fat lbs/c/d (n=7) | Milk Yield lbs/c/d | Milk Fat % | Milk Protein % | |
|---|---|---|---|---|---|
| Average | 6.2 | 0.7 | 92.7 | 4.2 | 3.2 |
| St.Dev. | 1.1 | 0.3 | 7.3 | 0.2 | 0.1 |
Plenish FFSBM nutrional components are comparable to commodity full-fat roasted soybeans (Table 2), with the anticpated exception of the fatty acid profile (Table 3). Oleic content exceeds minimum expectations with reliably high oleic fraction of TFA, mean=77.4%SD=1.2). Simultaneously, polyunsaturated fatty acid (PUFA) content is consistently low.
Table 2. Plenish FFSBM basic nutrition analyses.
| % Dry Matter (DM) | % Crude Protein (CP) | % Ether Extract Fat | % Total Fatty Acids (TFA) | |
|---|---|---|---|---|
| Average | 94.9 | 38.8 | 22.3 | 19.9 |
| St.Dev. | 1.1 | 1.3 | 0.9 | 0.7 |
Table 3. Plenish FFSBM fatty acid profile (%TFA).
| Palmitic Acid C16:0 | Stearic Acid C18:0 | Oleic Acid C18:1 | Linoleic Acid C18:2 | Linoleic Acid C18:3 | |
|---|---|---|---|---|---|
| Average | 6.2 | 4.5 | 77.4 | 5.9 | 6.0 |
| St.Dev. | 0.1 | 0.4 | 1.2 | 0.8 | 1.2 |
Roasting Efficacy
Roasting of soybeans increases protein value via greater Rumen Undegraded Protein (RUP), while denaturing urease enzymes and improving palatability. Protein Dispersion Index (PDI) in combination with RUP are considered the best currently available tools for assessing soybean heat treatment. PDI of 9-11 is considered optimal (Hsu and Satter, 1995). Samples with PDI of 11-14 are identified as slightly underheated (Dairyland Labs, Inc.). Of the samples surveyed, the average PDI is 13.6 (SD=1.9) with 8 of 19 samples underheated (PDI>14) and only two samples within the optimum range (Table 4).
Table 4. Plenish FFSBM roasting efficacy and particle size analyses.
| PDI % | Urease Activity (pH Δ) | RUP | UCP | Mean Particle Size (microns) | St. Dev. Particle Size | |
|---|---|---|---|---|---|---|
| Average | 13.6 | 0.1 | 63.3 | 7.6 | 1,698 | 2.1 |
| St.Dev. | 1.9 | 0.1 | 10.9 | 1.6 | 1,212 | 0.5 |
No samples with PDI>14 has >70%RUP, while no samples PDI<14 has urease activity greater than 0.1 pH change (Figure 1).
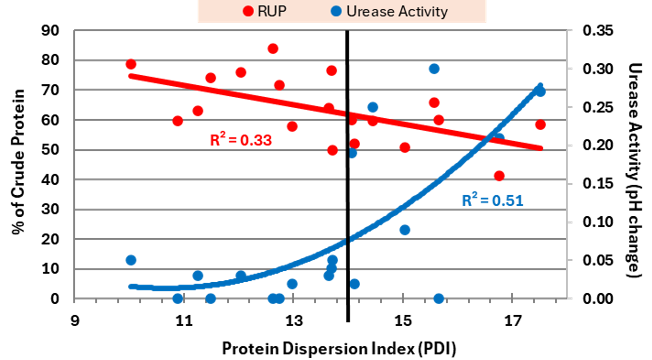
Figure 1. Protein Dispersion Index (PDI) in relation to Rumen Undegraded Protein (RUP) and urease activity in roasted Plenish FFSBM.
Thus, this sample population affirms PDI<14 as a reasonable maximum value for achieving adequate heat treament. Heat treatment had no effect on Undigested Crude Protein (UCP), which represents total tract protein availability (R2=0.33). With 42% of samples being underheated (PDI>14), there is significant opportunity for improving heat treatment, i.e. roasting efficacy, of the Plenish FFSBM represented in this survey. The correlation of RUP to PDI is fairly strong (r=-0.6). However, PDI is less reliable for predicting RUP of an individual sample.
Reducing Particle Size
Historical recommendations of halving and quartering roasted full-fat soybeans for lactating dairy cows are based on research conducted more than 25 years ago (Dhiman, et.al., 1997). Since then, cow milk output has greatly increased driven by higher dry matter intakes and rumen passage rates. This has led to uncertainty of optimum particle size for Plenish FFSBM as represented by the notable variation in mean particle size (MPS) in this data (Table 4).
Presumably, too large particle size will result in incomplete utilization of fat and elevated fecal fat. It is recommended that fecal fat not exceed 3% of total fecal DM for optimum dietary fat digestion (Diepersloot, et.al., 2024). In this survey, MPS is correlated to fecal fat (r=0.46, Figure 2).
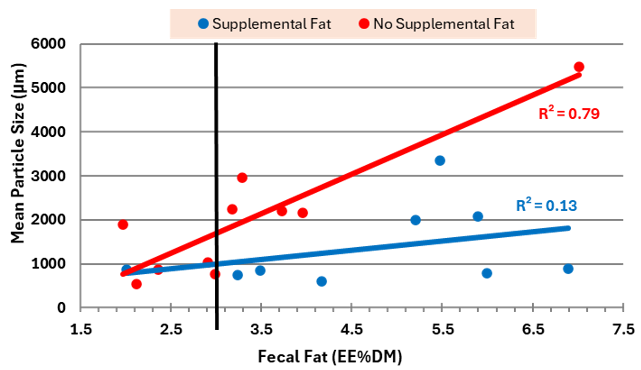
Figure 2. Plenish FFSBM mean particle size in relation to fecal fat for herds with and without other supplemental fat sources (e.g. palm) in the diet.
Of herds with FF ≤3%, all had MPS<2,000µm and 83% (5/6, exception MY <90 lbs/c/d) were <1,050µm. The relationship of MPS to FF is confounded by TMR-TFA which is highly correlated to FF (r=0.70). Using the Fat Ratio of feces to TMR (FF:TMR-TFA), reduces the correlation (r=0.47). However, the feeding of other fat supplements continues to bias the analysis. For greater clarity in optimizing MPS, only herds feeding no other supplemental fat sources are considered. Even with the less robust data set of herds not feeding supplemental fat sources (n=10), a strong relationship between MPS and FF:TMR-TFA can be observed as highly predictive (R2=1.00) for herds with MY≥90 lbs/c/d (Figure 3).
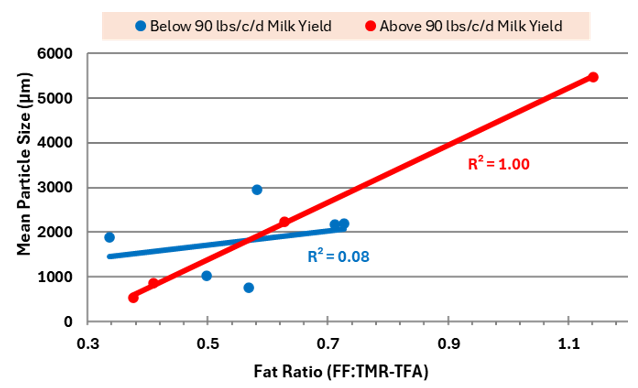
Figure 3. Fat Ratio [Fecal Fat to TMR total fatty acids (FF:TMR-TFA)] in relation to Plenish FFSBM mean particle size in herds not feeding other supplemental fat sources with average milk yield ± 90 lbs/cow/day.
Herds with MY ≥90 lbs/c/d, regardless of other supplemental fat sources, show a correlation between MPS and Fat Ratio (r=0.53). However, the negative correlation of range in particle size within the sample (reported as Standard Deviation Particle Size) and Fat Ratio is even greater (r= -0.63). This relationship is logical as range in particle size implies sustained availability of fat to the rumen between meals. Further investigation into the merits of more range, less uniform particle size is warranted. This data set is insufficient to assess whether particle size can be too fine with implications to RUP and rate of fat availability in the rumen.
Recommendations
Pending controlled research to provide greater certainty, this survey suggests:
- Plenish FFSBM heat treatment should target PDI<14.
- Plenish FFSBM MPS<1,000µm is preferred, especially for high producing dairy cows.
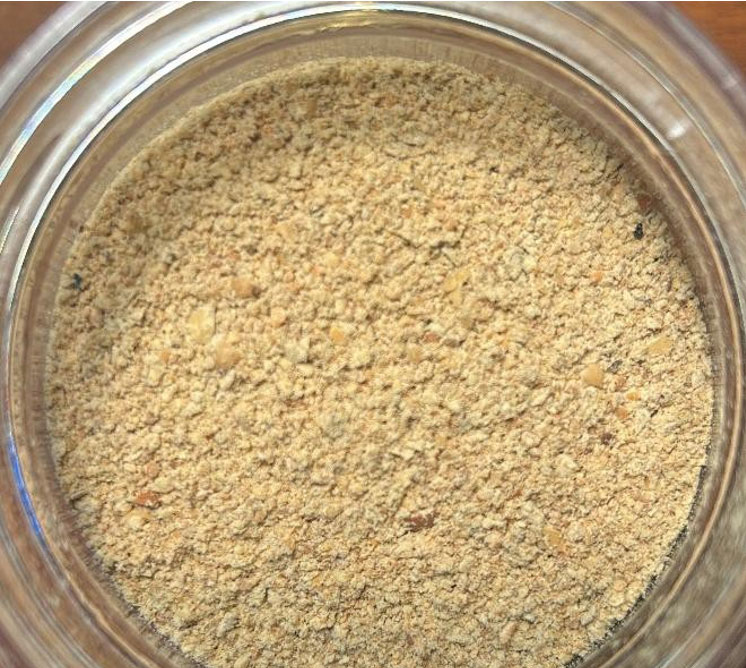
Mean Particle Size: 594 µm; PS SD: 1.1
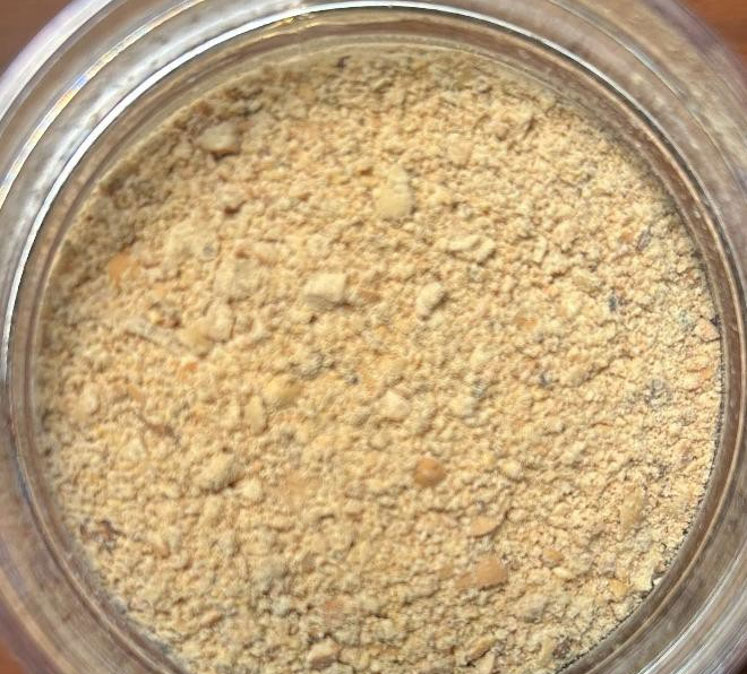
Mean Particle Size: 756 µm; PS SD: 1.1
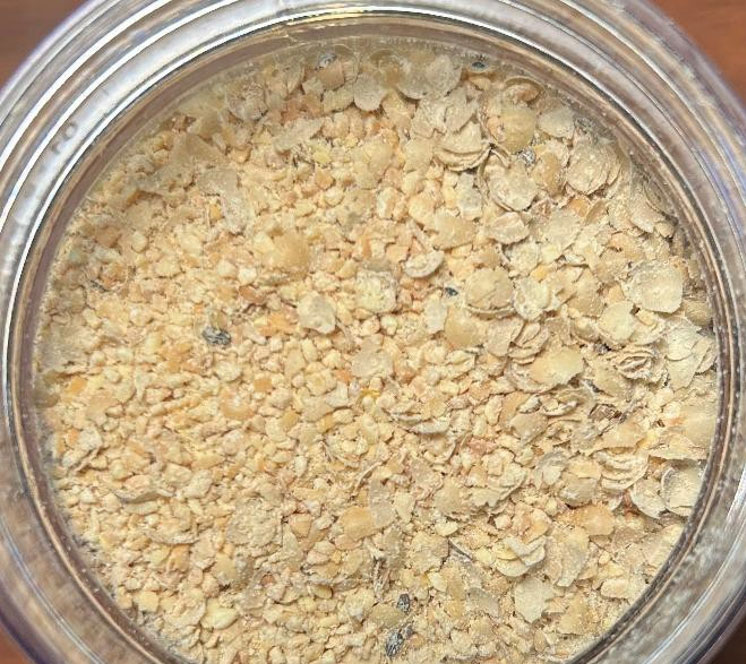
Mean Particle Size: 1,023 µm; PS SD: 1.1
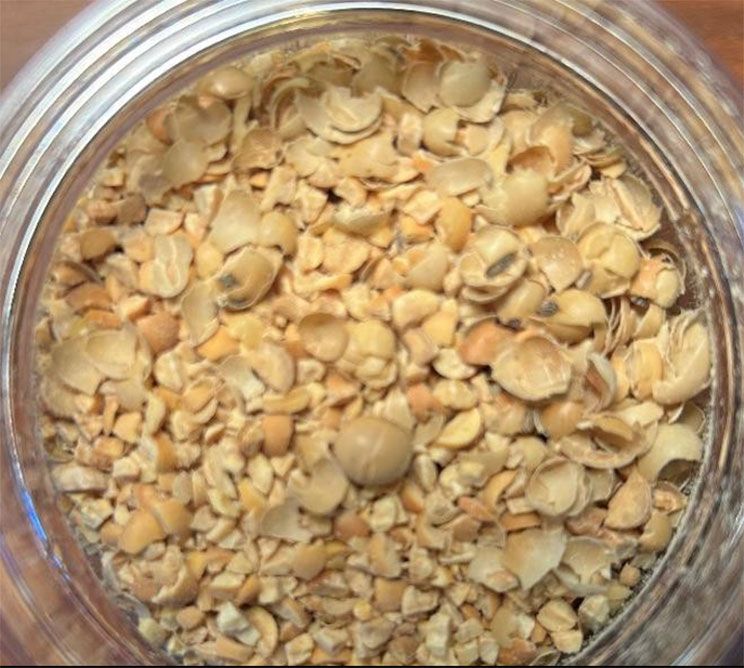
Mean Particle Size: 2,077 µm; PS SD: 1.1
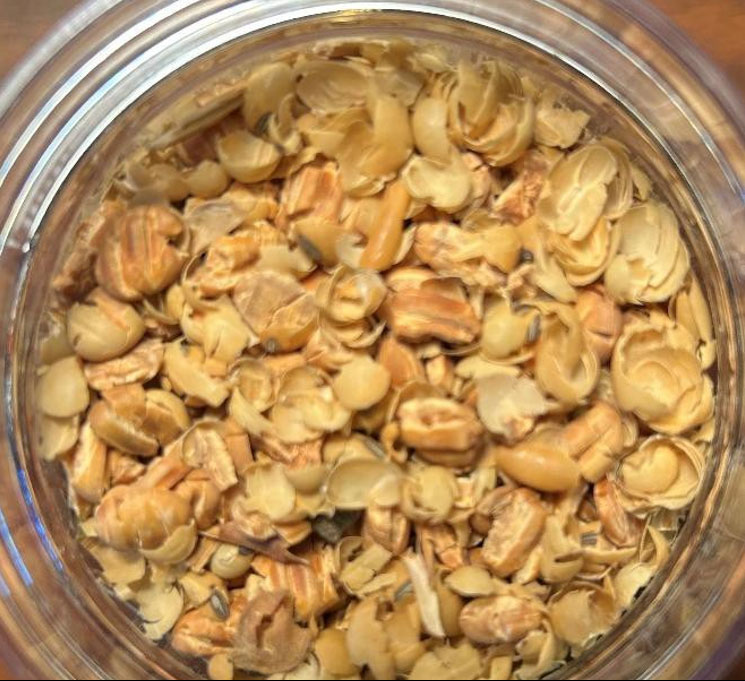
Mean Particle Size: 3,340 µm; PS SD: 1.1
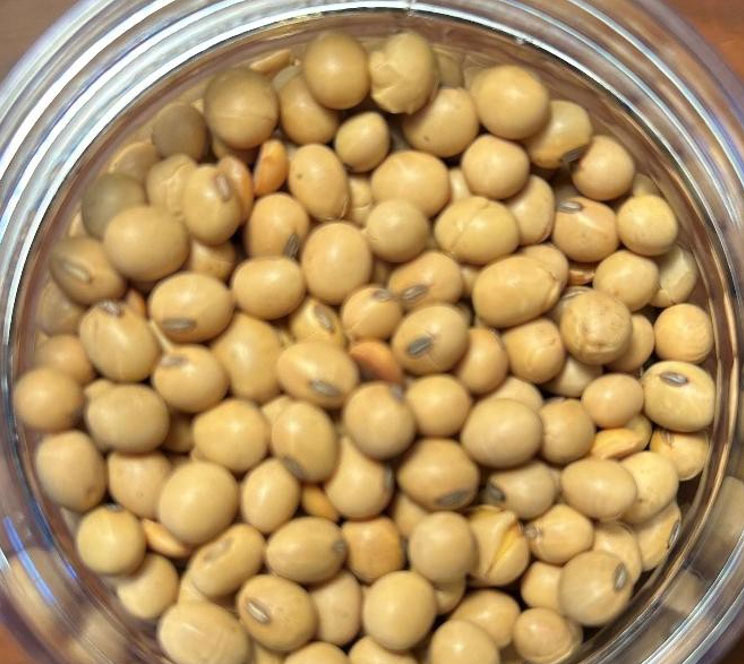
Mean Particle Size: 5,478 µm; PS SD: 1.1
Pioneer® brand products are provided subject to the terms and conditions of purchase which are part of the labeling and purchase documents.