
Country Selector
Please enter a valid location
Effects of Potassium Fertilizer Placement on Availability and Uptake
Written by Lauren E. Schwarck and Dr. Tony J. Vyn, Agronomy Department, Purdue University
Key Findings
- A five site-year field-scale experiment evaluated effects of potassium (K) fertilizer placement and tillage on K availability and uptake, and corn yield.
- Patterns of K stratification within the top 8 inches of the soil profile differed among tillage systems.
- Plant K concentration tended to be higher at V6 when fertilizer was incorporated with tillage, but no significant differences were detected at the R1 stage or in grain.
- Advantage to Banded K in Strip-Till?
- Purdue University Research
- Study Description
- Results
- Conclusions
- References
Advantage to Banded K in Strip-Till?
- Research has suggested a potential advantage to placement of potassium (K) fertilizer at depth in the soil rather than applying to the surface in conventional broadcasting (Bordoli and Mallarino, 1998; Mallarino et al., 1999).
- This conceptual benefit is in response to the significant stratification of plant-available K in the soil commonly observed in conservation tillage systems.
- However, it is important to acknowledge the variability in response to K placement due to subsequent soil conditions (precipitation, reduced tillage, etc.) following application as well as inherent soil-test K levels (Randall and Hoeft, 1988).
- Even when not banding, some researchers suggest that incorporation of K fertilizers into a greater amount of soil volume may benefit corn (Bell et al., 2017; Ebelhar and Varsa, 2000; Kovar and Barber, 1987; Randall and Hoeft, 1988).
Purdue University Research
- A five site-year field-scale experiment was conducted at the Agronomy Center for Research and Education (ACRE Farm) near West Lafayette, IN and Pinney Purdue Agriculture Center (PPAC Farm) near Wanatah, IN to evaluate effects of K fertilizer placement and tillage practices on K availability, uptake, and corn yield.
- This research was led by Dr. Tony Vyn and Lauren Schwarck of Purdue University and partially supported by the Pioneer Crop Management Research Awards (CMRA) Program.
Study Description
- Research at the ACRE farm alternated between two fields from 2016 to 2019; the study repeated following the soybean year with treatment positions fixed for data collection during corn years. Research at the PPAC farm was done in one field in 2019.
- Four K placement and tillage systems were compared:
- (NT) No-till with broadcast K
- (FST) Fall strip-till with banded K
- .(SST) Spring strip-till with banded K
- (FC) Fall chisel + spring field cultivation with broadcast K
- Tillage systems were compared with and without application of potassium and boron fertilizer (Aspire®, 0-0-58-0.5B) at a rate of 116 lbs K2O/acre.
- Strip-tillage was done in either the spring or fall using an Environmental Tillage Systems 6-row SoilWarrior coulter-type strip-till unit.
- Soil samples were taken shortly after planting each year to measure levels of plant-available potassium.
- Whole-plant tissue samples were taken at V6 and ear leaf samples at R1 to evaluate differences in potassium concentration among treatments.
Results
- Stratification of soil test K was evident in this experiment; an example from one site year of the study is shown in Figure 1.
- The strategic incorporation of fertilizer into the crop row within the strip-till systems led to what appears to be more stratification compared to FC and NT because the latter had fertilizer spread across the surface (between-row and in-row).
- The FC system had less evident stratification compared to NT due to mixing from tillage (Figure 1).
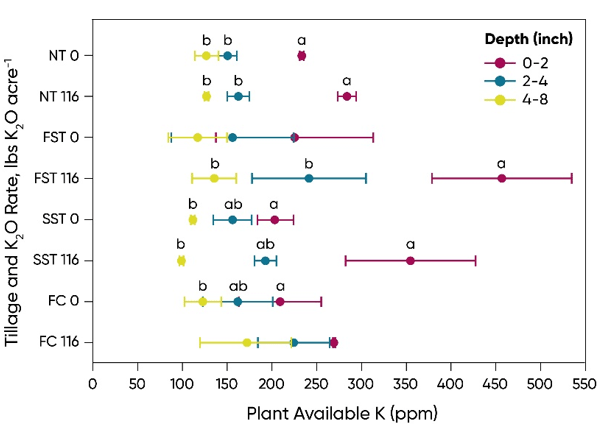
Figure 1. Example of K stratification in the soil profile. Concentration of K decreased with soil depth, but degree of stratification differed among tillage and K treatment systems. Letters indicate significant differences among the sampling depths at p<0.05.
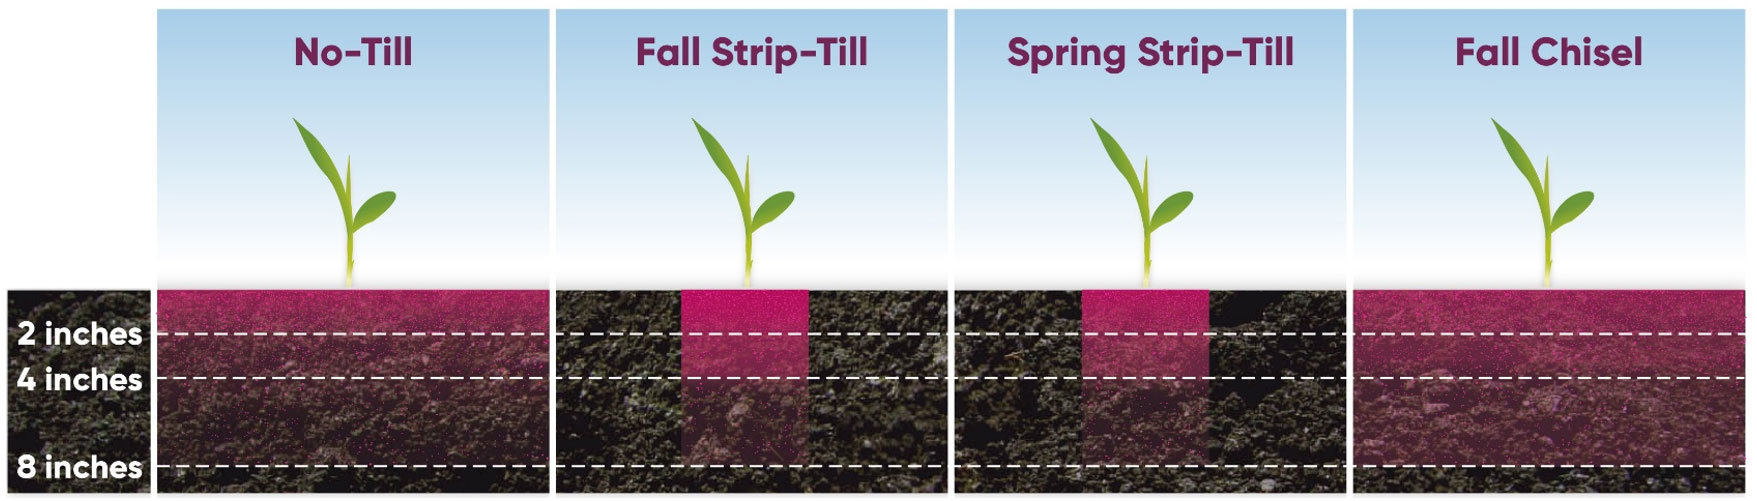
Figure 2. Visual representation of differences in K stratification among tillage systems with 116 lbs K2O/acre applied based on data shown in Figure 1. The fall chisel system had a more even distribution of K in the top 8 inches of soil than the no-till and strip-till systems. Banded application in the strip till systems greatly increased K concentration in the top 2 inches of soil in the row relative to broadcast application. Review a larger image here or by clicking on the above chart.
- Because of fertilizer placement in the crop row zones, FST and SST had the highest concentrations of K in the crop row. However, most of the increase in K concentration from fertilizer application was in the 0 to 2-inch depth, suggesting that coulter-based strip-till implements with above-surface delivery tubes may have difficulty placing fertilizer deeper than 2 inches. A visual representation of the differences in K stratification and application zones among tillage systems is shown in Figure 2.
- Early season samples collected at the V6 stage showed differences among tillage systems in K content (Figure 3).
- Corn in the NT treatment commonly had the lowest K content, with concentrations significantly lower than one or more of the tillage treatments observed in four out of five site years.
- Although V6 K content tended to be higher when fertilizer was incorporated with tillage, no significant differences among tillage systems in K concentration were detected with ear leaves at the R1 stage or in grain at maturity.
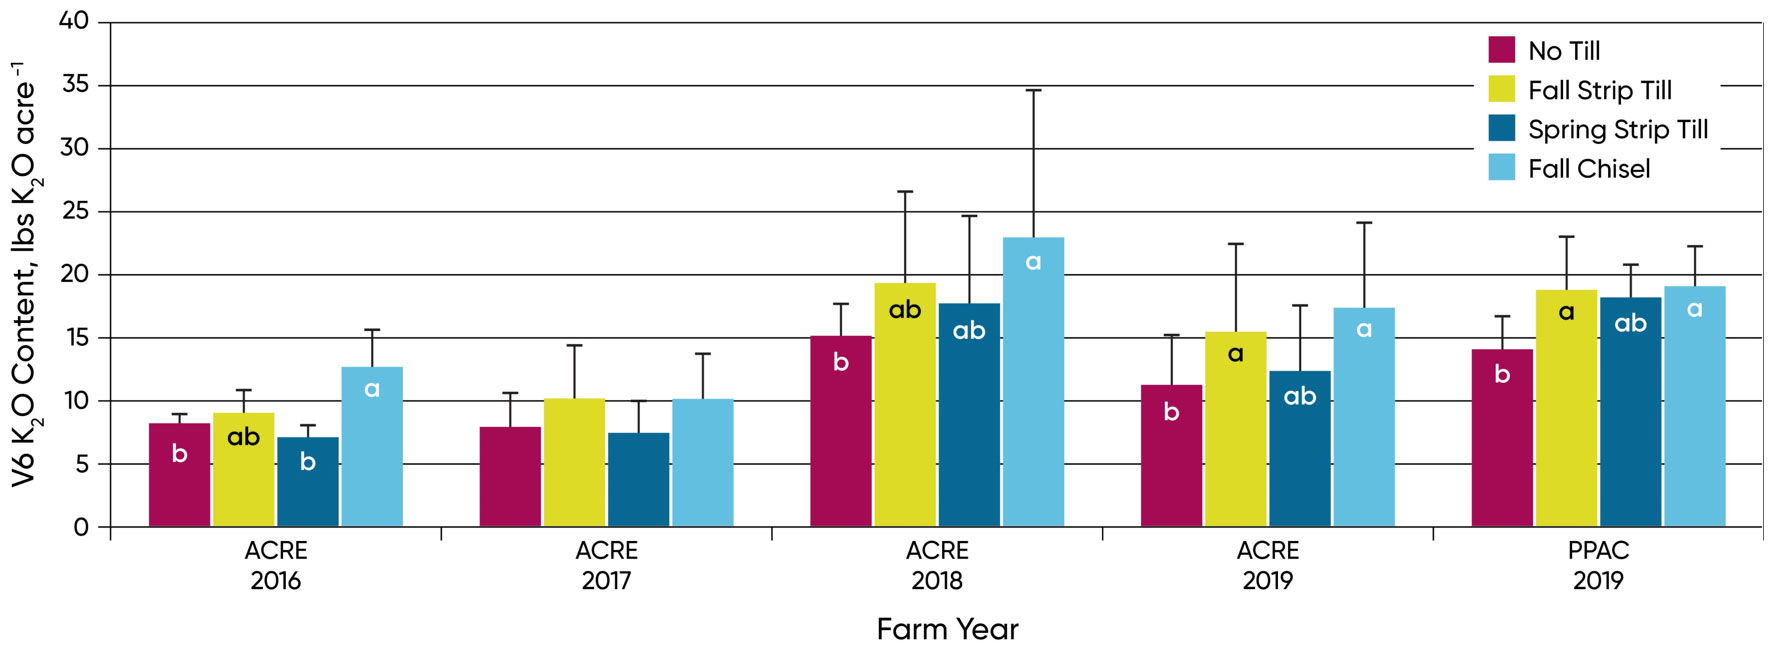
Figure 3. Average K20 content at V6 for the 116 lbs K2O/acre treatment within each tillage system. Letters represent significant differences among tillage systems at p<0.05 within a farm year. Review a larger image here or by clicking on the above chart.
Conclusions
- Stratification of K in the soil could limit K availability to corn during the growing season if near-surface moisture is scarce during periods of high plant K demand.
- Ensuring adequate K availability to corn plant can benefit the plant by helping with water regulation, improved tolerance to low temperatures (at the beginning of the growing season), disease/pest tolerance (corn can better avoid infection and tolerate higher levels of foliar damage), and improved N use efficiency (corn plants can better utilize N with better K fertility).
- More remains to be learned about how K nutrition can influence plant health in modern corn production systems and how farmers can maximize efficiency of K ffertilizer applications.
- The efficient use of K fertilizer is dificult to measure because of the influence a K fertilizer application can have over multiple years and the inability to detect all the K present in the soil.
References
- Bell, M.J., A.P. Mallarino, P. Moody, M. Thompson, and T.S. Murrell. 2017. Soil characteristics and cultural practices that influence potassium recovery efficiency and placement decisions. In T. S. Murrell & R. L. Mikkelsen (Eds.), Proceedings of Frontiers of Potassium Science Conference (pp. O277-O288). International Plant Nutrition Institute.
- Bordoli, J.M., and A.P. Mallarino. 1998. Deep and shallow banding of phosphorus and potassium as alternatives to broadcast fertilization for no-till corn. Agronomy Journal, 90(1), 27-33.
- Ebelhar, S.A., and E.C. Varsa. 2000. Tillage and potassium placement effects on potassium utilization by corn and soybean. Communications in Soil Science and Plant Analysis, 31(11-14), 2367-2377.
- Kovar, J.L., and S.A. Barber. 1987. Placing phosphorus and potassium for greatest recovery. Journal of Fertilizer Issues, 4(1), 1-6.
- Mallarino, A.P., J.M. Bordoli, and R. Borges. 1999. Phosphorus and potassium placement effects on early growth and nutrient uptake of no-till corn and relationships with grain yield. Agronomy Journal, 91(1), 37-45.
- Randall, G.W., and R.G. Hoeft. 1988. Placement methods for improved efficiency of P and K fertilizers: a review. Journal of Production Agriculture, 1(1), 70-79.
Research was supported in part by the Pioneer Crop Management Research Awards (CMRA) Program. This program provides funds for agronomic and precision farming studies by university and USDA cooperators throughout North America. The awards extend for up to four years and address crop management information needs of Pioneer agronomists, sales professionals, and customers.