
Country Selector
Please enter a valid location
Soybean Planting Date & Varietal Maturity Interact to Determine Yield
Research conducted by Dr. Emerson Nafziger and Jake Vossenkemper, University of Illinois, as a part of the Pioneer Crop Management Research Awards (CMRA) Program.
- Background
- Objective
- Study Description
- Results
- Northern Region (N. Illinois/Iowa)
- Central Region (Central Illinois)
- Conclusions
Background
- Over the last decade, researchers in the U.S. Corn Belt states have updated soybean planting date guidelines based on research showing maximum yields with late April to early May planting dates.
- Researchers have designed experiments to test if management strategies such as row spacing, seeding rate, and the decision to use seed treatments should change with these new planting date guidelines.
- However, few research efforts have been established to test if varietal maturity selection should change with the earlier planting date recommendations.
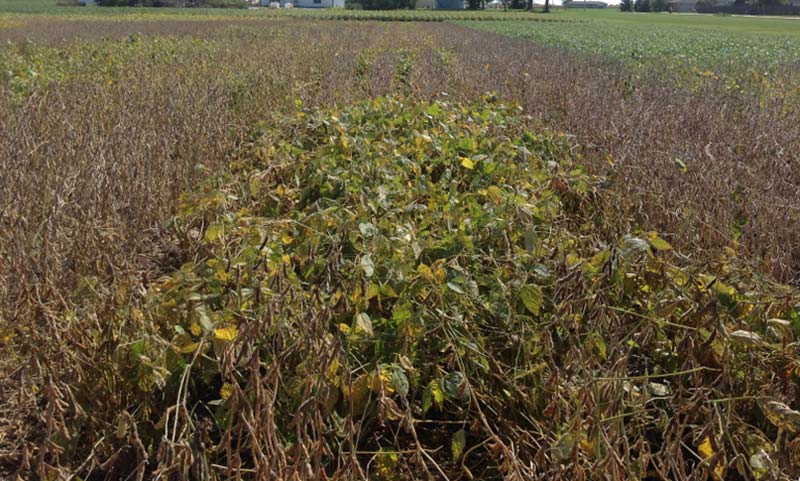
An MG 4.5 variety reaching harvest maturity later than earlier-maturing varieties at a research farm near Urbana, Ill. Photo taken on Sept. 19, 2014.
Objective
- A 3-year field research study was conducted as part of the Pioneer Crop Management Research Awards (CMRA) Program with Dr. Emerson Nafziger at the University of Illinois.
- The objective of this study was to test whether or not there is a need to change varietal maturity recommendations based on when soybeans are planted.
Study Description
- Replicated small-plot research trials were conducted from 2012 through 2014 at several Pioneer and University of Illinois research farms.
- In total there were 12 site-years (research locations) & 26 different Pioneer® brand soybean varieties used in these trials.
- 6 site-years in northern Illinois and 2 in central Iowa
- 4 site-years in central Illinois
- There were 2 planting dates used at each site, an “early” (targeting late April) and a “normal” (targeting late May) planting date
- For the purposes of data analysis, the 8 northern Illinois/Iowa and 4 central Illinois site-years were grouped separately.
- At the northern locations the varieties ranged in maturity from MG 1.9 to 3.8, with a “baseline” of 2.9
- At the central locations the varieties ranged in maturity from MG 2.5 to 4.5, with a baseline of 3.5
Results
- Averaged across all varieties, planting in late April or early May compared to late May/early June increased yields by 4.7 and 7.9 bu/acre in the northern and central regions, respectively
Table 1. Average grain yield, and the average early and normal planting dates for the 8 and 4 site-years in the northern and central regions.
Region # Site-Years Planting Date
(Average)Yield Early Normal Early Normal (bu/acre) Northern 8 April 28 June 1 70.8 66.1 Central 4 May 5 June 3 69.9 62.0 Average 70.4 64.1
- In both the northern and central regions, there were highly significant interactions (P<0.001) between planting date and varietal maturity.
- So we know that varietal maturity affected soybean yield, but we also can see that the effect of varietal maturity on grain yields was different for the early compared to the normal planting date.
Northern Region (N. Illinois/Iowa)
- In the northern region, maximum yields were produced by varieties 0.4 and 0.2 maturity units later than the mid-maturity (MG 2.9) baseline varieties at the early and normal planting dates, respectively (Figure 1).
- The interaction between varietal maturity and planting date in the northern region was the result of:
- Higher yields with early planting for the mid- and full-season varieties, but no such increase in yields for short-season varieties planted early.
- Those varieties that were 0.5 maturity units shorter to 1.0 unit longer than the mid-maturity baseline (2.9) varieties had higher yields when planted early, while those that were 0.5 to 1.0 units shorter than the mid-maturity varieties did not have higher yields with early compared to normal planting.
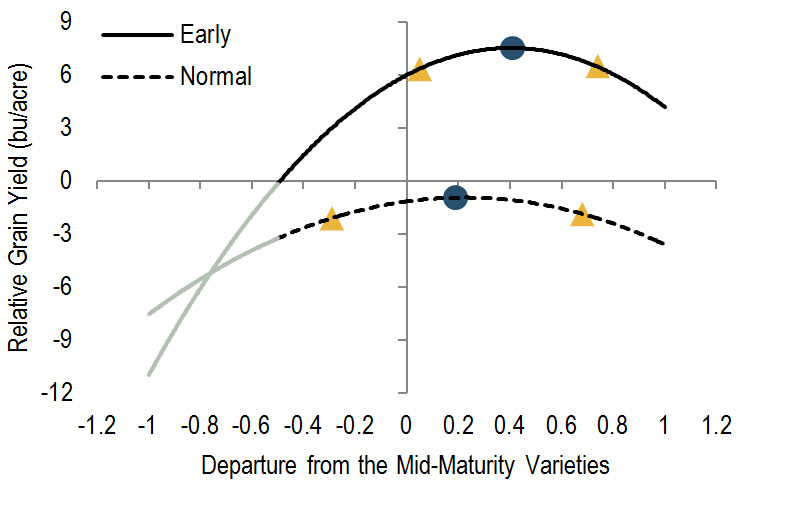
Figure 1. Interaction between varietal maturity across 8 site-years in the northern region. The blue dots indicate the maturity with maximum yields for each planting time and the yellow triangles represent the ends of ranges over which yields are within 1 bu/acre of the maximum yield. Gray lines show where differences were not significant at P=0.10.
Central Region (Central Illinois)
- In the central region, maximum yields were produced by varieties 0.1 maturity units longer and 0.3 maturity units shorter than the mid-maturity baseline (MG 3.5) varieties at the early and normal planting dates, respectively (Figure 2).
- The interaction between varietal maturity and planting date in the central region was a result of:
- Mid- and full-season varieties produced higher yields from early planting, but short-season varieties did not.
- The fullest-season varieties lost more yield when planting was delayed than did the short-season varieties.
- Those varieties that did not have higher yields with early planting were 0.3 maturity units shorter to 1.0 unit shorter than the mid-maturity baseline (3.5) varieties.
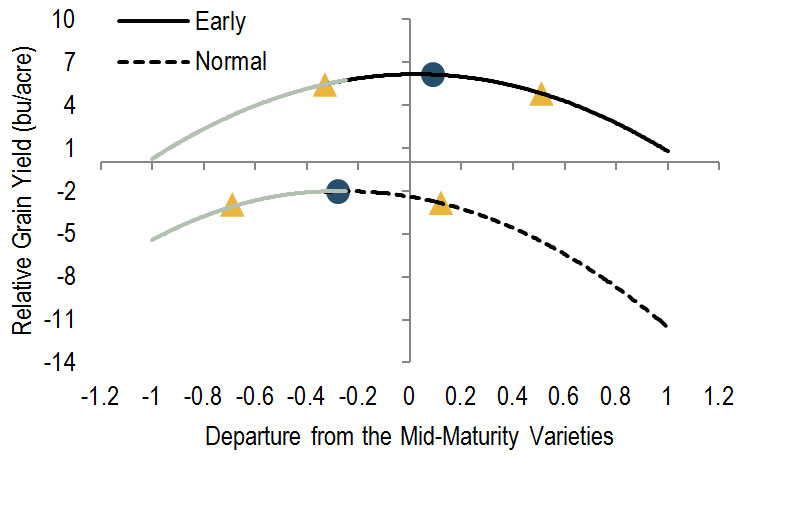
Figure 2. Interaction between varietal maturity across 4 site-years in the central region. The blue dots indicate the point of maximum yield and the yellow triangles represent the ends of ranges over which yields are within 1 bu/acre of the maximum yield. Gray lines show where differences were not significant at P=0.10.
Conclusions
- On average, yields within 1 bu/acre of the maximum were produced by varieties over a range of about 0.9 maturity units.
- Among individual site-years in the northern region, maximum yields were produced by varieties from as early as a 1.9 to as late as 3.8 relative maturity.
- Taken together, these 2 observations reconfirm that the focus should remain on selecting top-yielding genetics, and that these top-yielding varieties can be found over a modest range of maturities relative to the latitude of production.
- These findings suggest that growers who are often able to plant starting in late April or early May should consider making a small shift toward varieties later than MG 2.9 in the northern region, with less response expected from doing this (relative to the baseline of MG 3.5) in the central region.
- Any such shift should be small, perhaps only 0.2 or 0.3 units longer (e.g. from 2.9 to 3.1 or 3.2), and the emphasis should remain on choosing top-yielding varieties, not only on changing to longer maturity.
- Shorter-season varieties showed little yield increase from early planting in the central region, similar to what we found in the northern region. Though the interaction between planting date and maturity was less striking in this region compared to the northern region, fuller-season varieties lost a little more yield when planting was delayed than did earlier-maturing varieties.
- Data from more site-years in the central region would help strengthen these findings.
Research conducted by Dr. Emerson Nafziger and Jake Vossenkemper, University of Illinois, as a part of the Pioneer Crop Management Research Awards (CMRA) Program. This program provides funds for agronomic and precision farming studies by university and USDA cooperators throughout North America. The awards extend for up to 4 years and address crop management information needs of Pioneer agronomists, Pioneer sales professionals and customers.
The foregoing is provided for informational use only. Please contact your Pioneer sales professional for information and suggestions specific to your operation. 2012-2014 data are based on average of all comparisons made in 12 locations through Dec 1, 2014. Multi-year and multi-location is a better predictor of future performance. Do not use these or any other data from a limited number of trials as a significant factor in product selection. Product responses are variable and subject to a variety of environmental, disease, and pest pressures. Individual results may vary.