
Country Selector
Please enter a valid location
Corn Response to Reduced Nitrogen Environments in a 17-Year Study

Agronomy Research Update
Written by Mark Jeschke, Ph.D., Pioneer Agronomy Manager
Key Findings
- Pioneer conducted a nitrogen rate by crop rotation study in which nitrogen rate treatments were applied in the same locations of the field over multiple years.
- Corn grown in rotation with soybeans was generally able to yield better under reduced nitrogen rates than corn grown continuously.
- Yield of rotated corn with no applied nitrogen gradually recovered over time, with almost no yield loss observed after the 10th year of the study. This outcome is unusual and the reason for it is unknown.
- Objectives
- Video: Let's Talk Nitrogen
- Study Description
- Results
Objectives
- Beginning in 2006, Pioneer conducted an annual study to evaluate the response of corn in limited nitrogen environments.
- This study was unique in that each nitrogen rate treatment was positioned on precisely the same field area each year.
- This allowed researchers to examine corn response to each nitrogen level over multiple years of production.
- In addition, after many years of no added nitrogen, the “zero-N” treatment represented a truly nitrogen deficient environment.
Video: Let's Talk Nitrogen
Study Description
- The reduced nitrogen study was conducted over multiple years between 2006 and 2014 at four Corteva agriscience research stations located in Corn Belt states (Table 1).
- The study at the Johnston, IA research station was maintained continuously up through 2022.
- The York, NE location was irrigated; all others were rain-fed.
Table 1. Reduced nitrogen study locations.
Study Locations Years Johnston, IA 2006-2022a Windfall, IN 2007-2014b Champaign, IL 2007-2014 York, NE 2008-2014 aYield data not collected in 2012 (extreme drought), 2015 (wind damage), 2018 (flooding and wind damage), 2019 (flooding and wind damage), and 2020 (extreme wind damage).
bYield data not collected in 2011 (flooding) and 2012 (extreme drought).
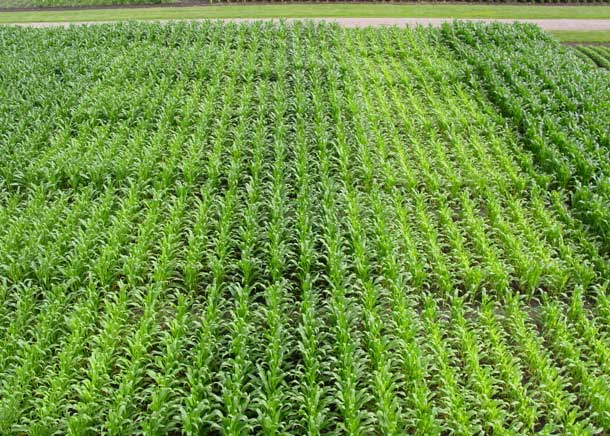
Figure 1. Reduced nitrogen study at Johnston, IA showing visible nitrogen deficiency symptoms in the low nitrogen rate treatments in the continuous corn block (June 11, 2009).
- Each location included two crop rotations and five nitrogen rates within each rotation for a total of 10 treatments:
Crop Rotations:
- Continuous corn
- Corn-soybean rotation
Nitrogen Rates (% of full rate):
- 0%, 50%, 70%, 100%, 130%
- Each location included two corn-soybean rotation blocks, so that corn yield from the rotation could be measured every year of the study (Figure 2). One block was planted to corn in even-numbered years and the other in odd-numbered years.
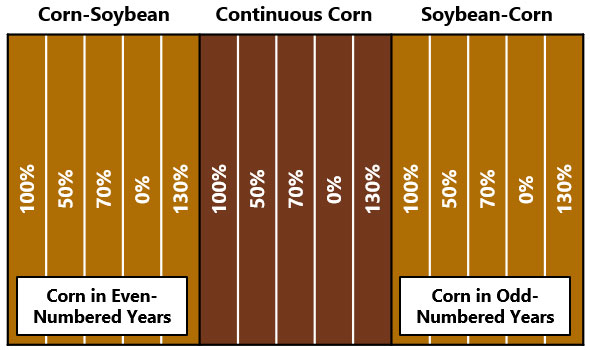
Figure 2. Plot layout of the reduced nitrogen study at Johnston, IA.
- For the first six years of the study, nitrogen rate treatments were based on a percentage of a “full-rate” treatment.
- The nitrogen rate considered to be a full-rate (100%) treatment differed among years and locations based on determinations of economically optimum rates for each site-year.
- Beginning in 2012, the study was changed to use a fixed set of nitrogen rates that were maintained continually at the Johnston, IA location through 2022. Actual nitrogen rates for the Johnston study are shown in Table 2.
Table 2. Nitrogen rates in lbs N/acre used in continuous corn and corn-soybean rotation in the reduced nitrogen study at Johnston, IA.
Continuous Corn
| Percent of Full Rate | 2006-2007 | 2008 | 2009 | 2010 | 2011 | 2012-2022 |
|---|---|---|---|---|---|---|
| ------------- lbs N/acre ------------- | ||||||
| 0% | 0 | 0 | 0 | 0 | 0 | 0 |
| 50% | 76 | 92 | 74 | 90 | 100 | 75 |
| 70% | 106 | 129 | 104 | 126 | 140 | 150 |
| 100% | 152 | 184 | 148 | 180 | 200 | 225 |
| 130% | 198 | 239 | 192 | 234 | 260 | 300 |
Corn-Soybean Rotation
| Percent of Full Rate | 2006-2007 | 2008 | 2009 | 2010 | 2011 | 2012-2022 |
|---|---|---|---|---|---|---|
| ------------- lbs N/acre ------------- | ||||||
| 0% | 0 | 0 | 0 | 0 | 0 | 0 |
| 50% | 52 | 63 | 49 | 70 | 75 | 50 |
| 70% | 73 | 88 | 69 | 98 | 105 | 100 |
| 100% | 104 | 126 | 98 | 140 | 150 | 150 |
| 130% | 135 | 164 | 127 | 182 | 195 | 200 |
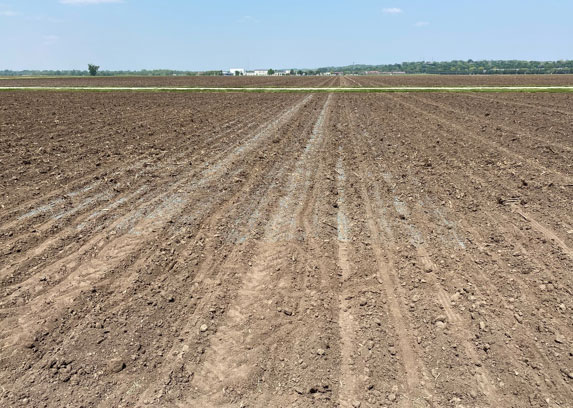
Figure 3. Stabilized urea (urea + DCD + NBPT) on the soil surface immediately after application. Johnston, IA; May 22, 2023.
- Nitrogen treatments were applied as a single application. Application timing varied from immediately after planting to approximately V2 stage depending on the location and year.
- Nitrogen was surface applied as ammonium nitrate during the first four years of the study and as stabilized urea from 2010 onward at all locations except York, NE where it was sidedressed as 28% UAN (Figure 3).
- Nitrogen fertilizer was applied by hand to ensure precise placement (Figure 4).
- Each rotation x nitrogen rate treatment plot was 8 rows wide (30-inch row spacing) and length varied by location. At Johnston, the plots were 122 ft long from 2006 through 2018 and 105 ft long from 2019 onward.
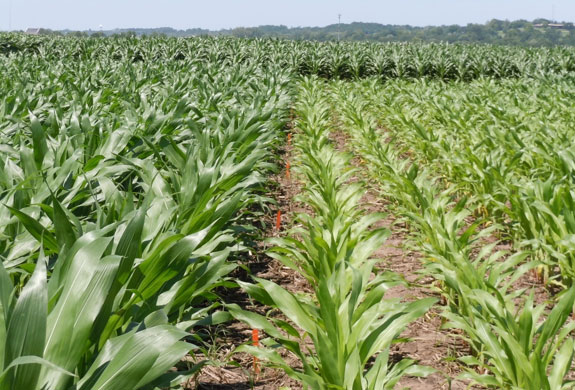
Figure 4. Visual nitrogen deficiency symptoms indicated that hand application of fertilizer was successful for achieving precise placement and establishment of nitrogen deficient environments.
- The corn hybrid used at a given location differed from year to year and was typically a Pioneer® brand corn leader product for that particular geography.
- In 2011, 2012, 2013, and 2014 the nitrogen rate treatments were split between two hybrids to determine whether the hybrids would respond differently to crop rotation and reduced nitrogen environments (Table 3).
Table 3. Pioneer® brand corn products used in the Johnston, IA reduced nitrogen study, 2007-2023.
| Year(s) | Hybrid/Brand1 |
|---|---|
| 2007 | 34A20 (HXX,LL,RR2) |
| 2008 | 34R67 (HX1,LL,RR2) |
| 2009-2010 | 33M16 (HX1,LL,RR2) |
| 2011 | 33T57 (HX1,LL,RR2), 34N42 (HX1,LL) |
| 2012-2014 | P1498AM™ (AM,LL,RR2), 33D53AM™ (AM,LL,RR2) |
| 2015 | P1498AM™ (AM,LL,RR2) |
| 2016-2018 | P1197AM™ (AM,LL,RR2) |
| 2019-2020 | P1093Q™ (Q,LL,RR2) |
| 2021-2023 | P1185Q™ (Q,LL,RR2) |
1All Pioneer products are hybrids unless designated with AM1, AM, AML, AMT, AMX, AMXT and Q, in which case they are brands.
Results
All Locations: 2006-2014
- Across all study locations, corn rotated with soybean had greater top-end yield and less yield penalty associated with reduced nitrogen fertilizer rates compared to continuous corn (Figure 5 and Figure 6).
- Corn yield response to nitrogen rate differed between the rain-fed eastern sites (Johnston, Windfall, and Champaign) and the irrigated western site (York).
- The irrigated site had less of a yield penalty associated with reduced nitrogen rates compared to the rain-fed sites, particularly for rotated corn (Figure 6).
- In rotated corn, the average reduction in yield with zero nitrogen was 35% across the rain-fed sites, compared to only 14% at the irrigated site.
- In continuous corn, the average reduction in yield with zero nitrogen was 65% across the rain-fed sites, and 46% at the irrigated site.
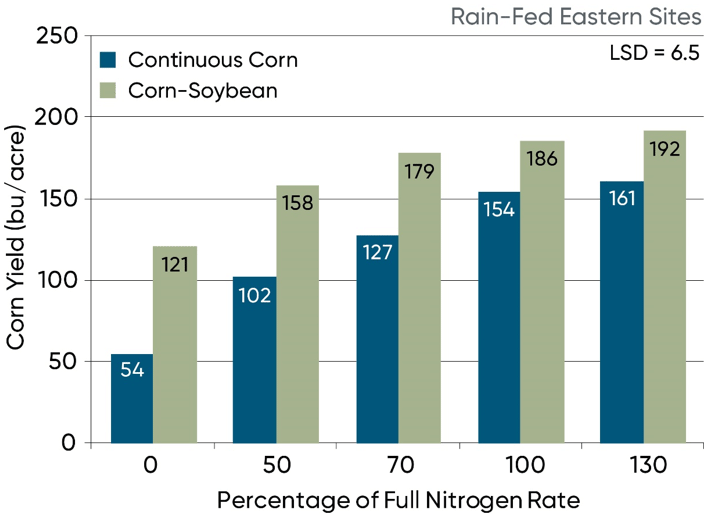
Figure 5. Influence of nitrogen rate and crop rotation on yield averaged over years (2006-2014) for rain-fed eastern sites (IA, IN, IL).
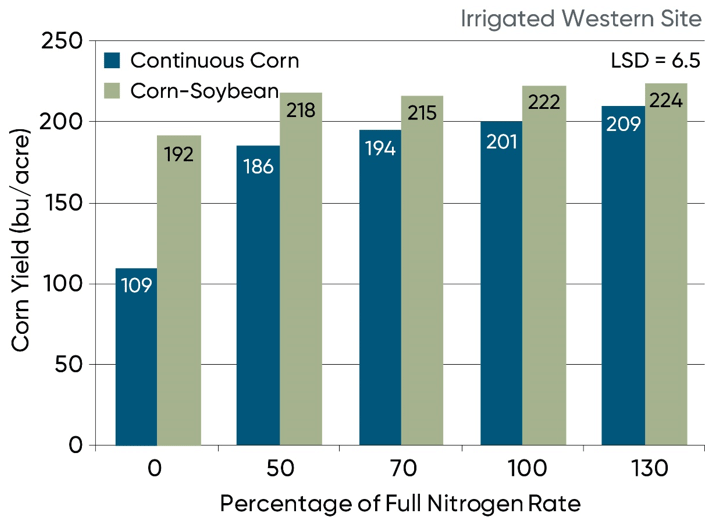
Figure 6. Influence of nitrogen rate and crop rotation on yield averaged over years (2008-2014) for the irrigated western site (NE).
Hybrid Comparisons: 2011-2014
- The design of this study, with reduced nitrogen rate treatments maintained in the same locations for multiple years, provided the opportunity to compare hybrid performance in established nitrogen stress environments.
- Hybrid comparisons were first conducted in 2011, after each study location had been established for at least three years, and continued through 2014.
- Each eight-row nitrogen rate treatment strip was split into four rows of each hybrid, with the same two hybrids used across all sites.
- In 2011, Pioneer® hybrid 33T57 and 34N42 were compared in the study, based on previous Pioneer research which showed 33T57 to be more tolerant than 34N42 of low residual soil N levels, and less likely to lose yield under N stress.
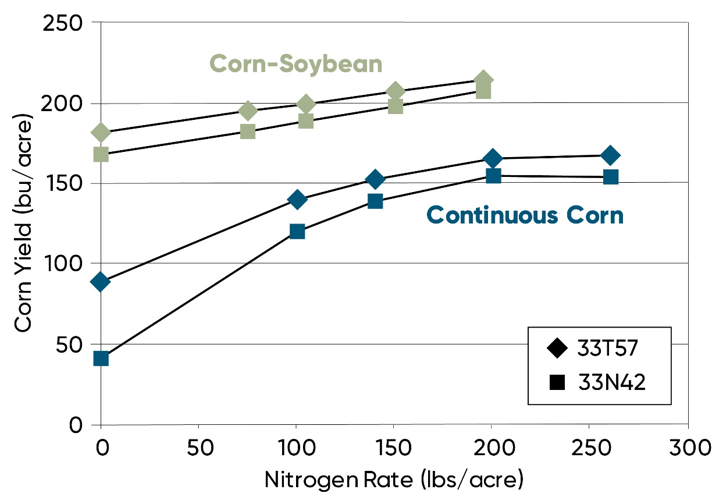
Figure 7. Response of Pioneer 33T57 and 34N42 to nitrogen rates under continuous corn and corn-soybean rotation, averaged across the Champaign, Johnston, and York sites.
- Pioneer 33T57 was higher yielding than 33N42 across all nitrogen rates in both rotations (Figure 7).
- In the corn-soybean rotation, both hybrids responded similarly to nitrogen rate, with yield increasing linearly up to the highest nitrogen rate.
- In continuous corn, the two hybrids diverged in their performance at the zero nitrogen rate, with Pioneer 33T57 showing greater yield stability than 34N42 under extreme nitrogen deficiency.
- In 2012, the hybrid comparison was repeated, but with two different hybrids, Pioneer P1498AM™ and 33D53AM™ brand corn, with the former expected to show greater yield stability under nitrogen deficiency. This comparison was continued through 2014.
- Results differed between the eastern rain-fed sites and the western irrigated site.
- Across the eastern sites, yield response of the two hybrids to nitrogen rate was very similar in both rotated and continuous corn (Figure 8).
- At the irrigated site, P1498AM had a significant yield advantage over 33D53AM in continuous corn at the higher nitrogen rates.
- The hybrids responded similarly to nitrogen rate in rotated corn.
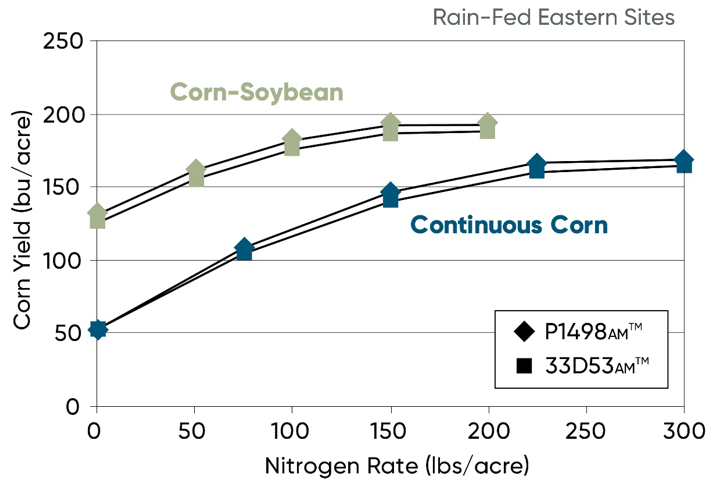
Figure 8. Response of Pioneer P1498AM and P33D53AM to nitrogen rates under continuous corn and corn-soybean rotation, averaged across the eastern rain-fed sites in 2012, 2013, and 2014 (Champaign, Windfall, and Johnston).
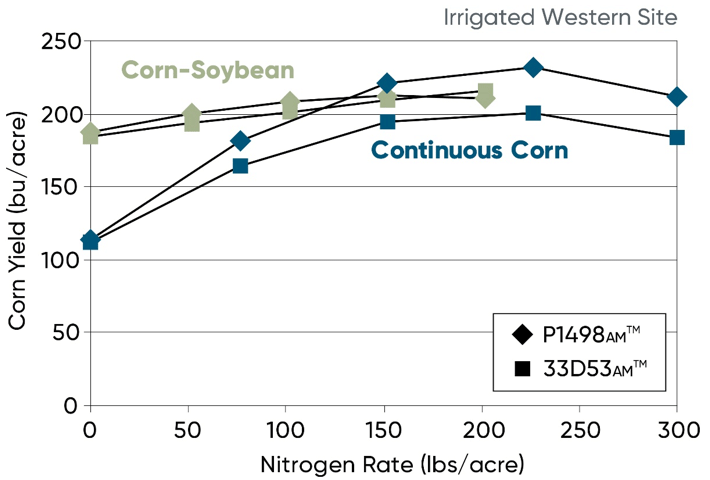
Figure 9. Response of Pioneer P1498AM and P33D53AM to nitrogen rates under continuous corn and corn-soybean rotation, at the western irrigated site in 2012, 2013, and 2014 (York, NE).
Johnston, IA Long-Term Results: 2006-2022
- The study was continued at the Johnston, IA site through 2022, providing the opportunity to look at long-term trends in corn yield response to reduced nitrogen environments.
- There were a few seasons in which the ability to collect quality yield data was compromised by severe weather damage, so results were grouped into two time periods: 2007-2011, which included an unbroken five-year stretch of yield data, and 2016-2022, which included four years of yield data from 2016, 2017, 2021, and 2022.
- During the 2007-2011 period, rotated corn had greater top-end yield and less yield penalty associated with reduced nitrogen rates compared to continuous corn (Figure 10).
- In the zero nitrogen treatment, yield was reduced by 60% in continuous corn and 37% in rotated corn.
- Yield of both rotated and continuous corn increased substantially in the 2016-2022 time period compared to the 2007-2011 period, reflecting the genetic gain and higher yield potential of newer hybrids (Figure 10 and Figure 11).
- Nitrogen treatment rates were higher for the latter time period, due to the switch to higher fixed rates beginning in 2012.
- Yield response to nitrogen rate in continuous corn was similar between time periods, with the zero nitrogen treatment yielding 60% less than the full nitrogen rate treatment in both 2007-2011 and 2016-2022.
- In rotated corn, however; nitrogen rate response changed considerably between time periods, with yield response to nitrogen nearly disappearing during the 2016-2022 period.
- The zero nitrogen treatment in rotated corn reduced yield by 37% compared to a full rate in 2007-2011, but only 4% in 2016-2022 (Figure 11).
- Visual nitrogen deficiency symptoms in the field corresponded with measured yield results.
- Distinct yellowing of the plants was observed in the lower nitrogen rates in continuous corn, with detectable deficiency symptoms in the zero nitrogen strip appearing soon after emergence.
- In the rotated corn, nitrogen deficiency symptoms were nearly nonexistent in the latter years of the study, even in the zero nitrogen strip.
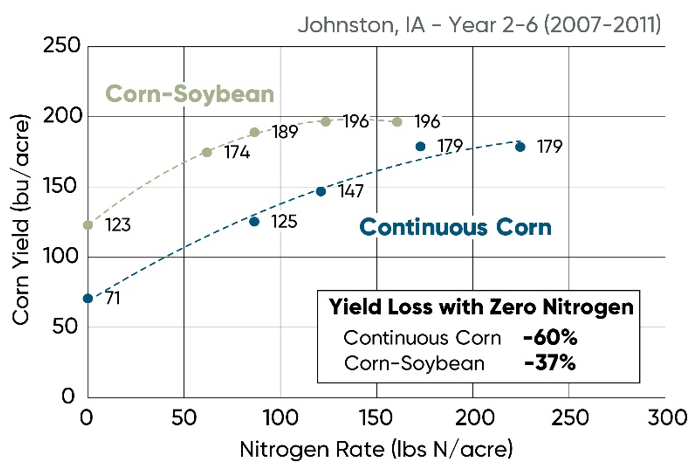
Figure 10. Corn yield response to nitrogen rate in continuous corn and corn-soybean rotation at Johnston, IA from 2007-2011. Actual nitrogen rates differed by years, so rates shown are averages for this time period.
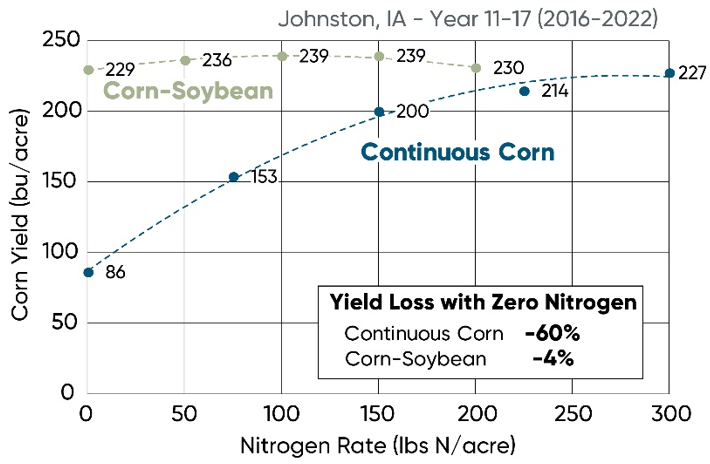
Figure 11. Corn yield response to nitrogen rate in continuous corn and corn-soybean rotation at Johnston, IA from 2016-2022.
- Figure 12 and Figure 13 show corn yield of the full nitrogen rate and zero nitrogen treatments in continuous corn and rotated corn, respectively, over all years of the study at Johnston, IA.
- Relatively little yield loss occurred with zero nitrogen in the first year of the study, but yields dropped off substantially in the second and third years.
- Beyond the third year, yield loss with zero nitrogen stayed relatively constant in continuous corn with approximately 60% yield reduction compared to a full nitrogen rate.
- In rotated corn, however; yield in the zero nitrogen treatment recovered over time. The yield gap appears to narrow somewhat in 2013 and 2014 and nearly disappears in 2016.
- The years following 2016 in which it was possible to collect yield data all produced similar results, with the yield penalty not exceeding 6% in 2017, 2021, and 2022.
- Yield outcomes for the other reduced nitrogen rates are not shown but followed similar trends as the zero nitrogen treatment, gradually closing the yield gap with the full rate treatment over time.
- Caution is justified in considering the results, as this is a non-replicated trial, conducted at only one location in its later years.
- However, it is worth noting that the yield data for the corn soybean rotation came from two separate blocks. If some sort of plot effect or misapplication of fertilizer was affecting the outcome, it would most likely show up in the even-numbered or odd-numbered years, but not both.
- The long-term trends observed in this study at the Johnston site were unexpected and the reason for them is unknown. Further investigation is warranted. This study remains ongoing.
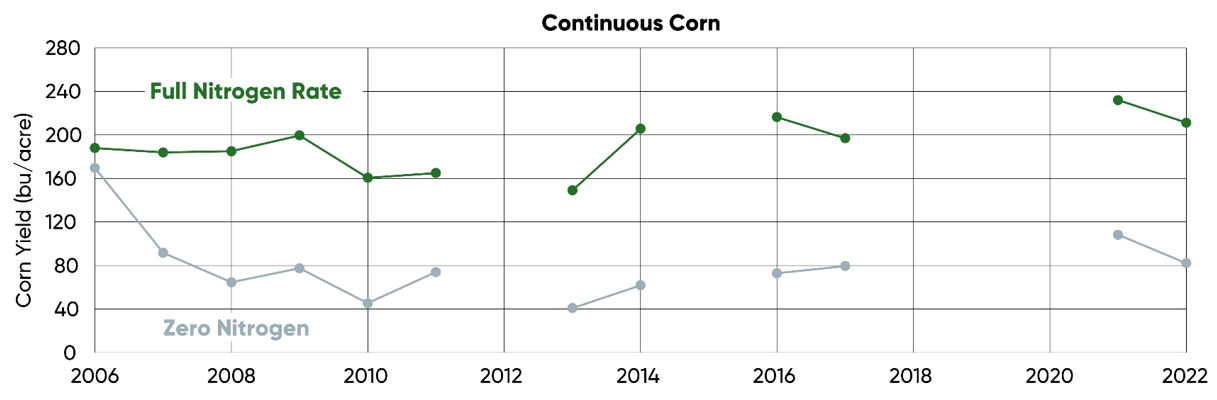
Figure 12. Yield of continuous corn with a full nitrogen rate and zero nitrogen at Johnston, IA from 2006-2022.
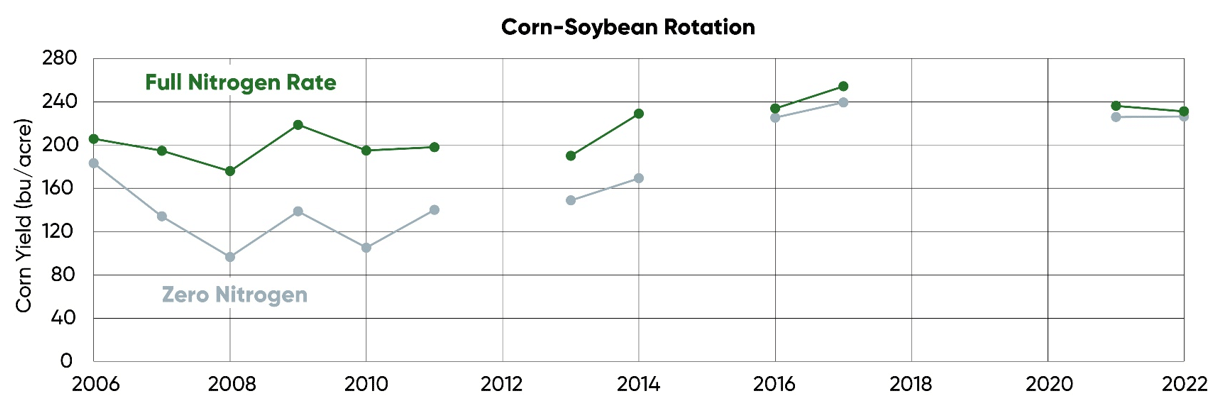
Figure 13. Yield of rotated corn with a full nitrogen rate and zero nitrogen at Johnston, IA from 2006-2022.





Q (Qrome®) - Contains a single-bag integrated refuge solution for above- and below-ground insects. The major component contains the Agrisure® RW trait, the Bt trait, and the Herculex® XTRA genes. In EPA-designated cotton growing counties, a 20% separate corn borer refuge must be planted with Qrome products. AM - Optimum® AcreMax® Insect Protection system with YGCB, HX1, LL, RR2. Contains a single-bag integrated refuge solution for above-ground insects. In EPA-designated cotton growing counties, a 20% separate corn borer refuge must be planted with Optimum AcreMax products. HX1 - Contains the Herculex® I Insect Protection gene which provides protection against European corn borer, southwestern corn borer, black cutworm, fall armyworm, lesser corn stalk borer, southern corn stalk borer, and sugarcane borer; and suppresses corn earworm. LL - Contains the LibertyLink® gene for resistance to Liberty® herbicide. RR2 - Contains the Roundup Ready® Corn 2 trait that provides crop safety for over-the-top applications of labeled glyphosate herbicides when applied according to label directions. ALWAYS READ AND FOLLOW PESTICIDE LABEL DIRECTIONS. Roundup Ready® crops contain genes that confer tolerance to glyphosate, the active ingredient in Roundup® brand agricultural herbicides. Roundup® brand agricultural herbicides will kill crops that are not tolerant to glyphosate. Agrisure® is a registered trademark of, and used under license from, a Syngenta Group Company. Agrisure® technology incorporated into these seeds is commercialized under a license from Syngenta Crop Protection AG. Roundup Ready® is a registered trademark used under license from Monsanto Company. Liberty®, LibertyLink® and the Water Droplet Design are trademarks of BASF.
The foregoing is provided for informational use only. Please contact your Pioneer sales professional for information and suggestions specific to your operation. 2006-2022 data are based on average of all comparisons made in four locations through December 1, 2022. Multi-year and multi-location is a better predictor of future performance. Do not use these or any other data from a limited number of trials as a significant factor in product selection. Product responses are variable and subject to a variety of environmental, disease, and pest pressures. Individual results may vary.