
Country Selector
Please enter a valid location
High Yield Sorghum Production
- National Sorghum Producers Yield Contest
- Hybrid Selection
- Seeding Rate
- Row Spacing
- Nitrogen Fertilizer
National Sorghum Producers Yield Contest
- The National Sorghum Producers (NSP) Yield Contest provides a benchmark for yields that are attainable under optimal conditions and management.
- The NSP Yield Contest recognizes three national winners annually in each of five production divisions in east and west regions:
- Irrigated Tillage
- Irrigated No-Till
- Dryland Tillage
- Dryland No-Till
- Food Grade
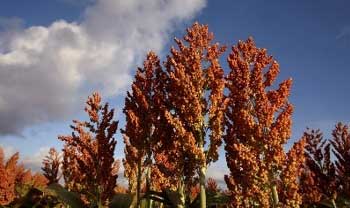
- Average yields of national winners in each division are shown in Figure 1.
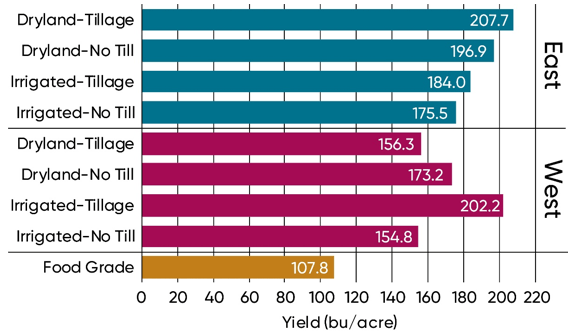
Figure 1. Average yield of 2019 NSP Yield Contest national winners by contest category.
Hybrid Selection
- Selecting the right hybrid is likely the most important management decision of all those made by contest winners.
- Maximizing yield requires matching hybrid characteristics with field attributes such as moisture supplying capacity, insect and disease spectrum and intensity, maturity zone, residue cover, and even seedbed temperature.
- Pioneer® brand products were used in 22 out of 25 NSP Yield Contest national winners in 2012-2017 (Figure 2).
- Seven different Pioneer brand sorghum hybrids were national winners in 2019, in 11 different states (Table 1).
- All eight national winners that exceeded 200 bu/acre were planted to Pioneer brand sorghum hybrids (Figure 2).
Table 1. 2019 NSP Yield Contest national winning entries using Pioneer brand products (East Division).
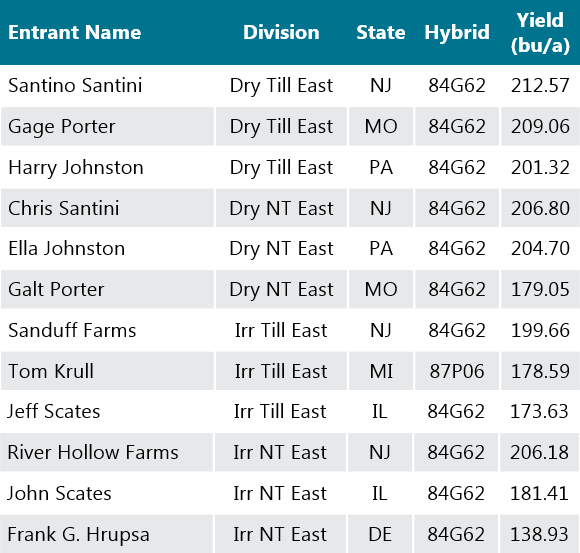
Table 1. 2019 NSP Yield Contest national winning entries using Pioneer brand products (West Division).
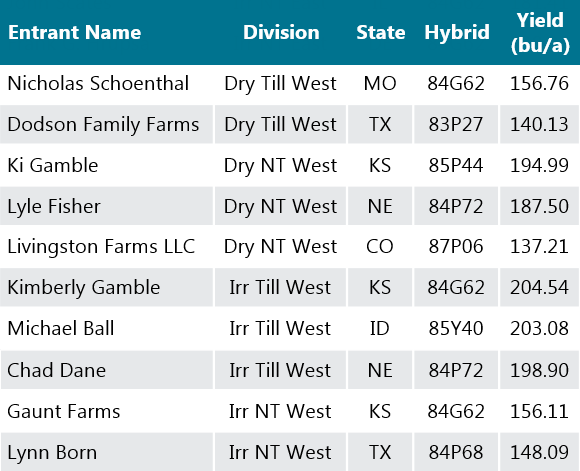
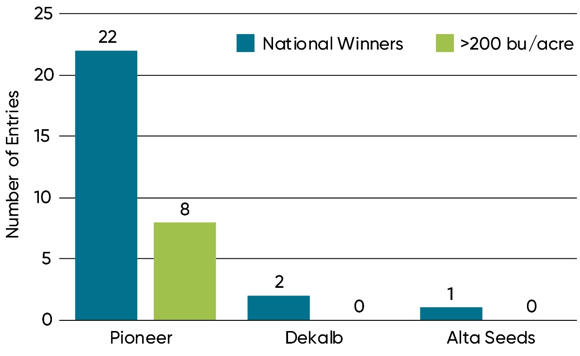
Figure 2. Seed brand planted by NSP Yield Contest national winners and winners yielding above 200 bu/acre in 2019.
Seeding Rate
- Seeding rate of NSP Yield Contest winning entries varied among divisions (Figure 3).
- Average seeding rate of national winners in eastern region divisions was 106,000 seeds/acre compared to 65,000 seeds/acre in western region divisions.
- Average seeding rate of national winners was greater than that of contest entries in general in most divisions.
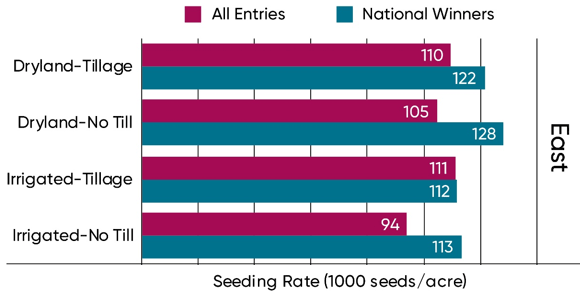
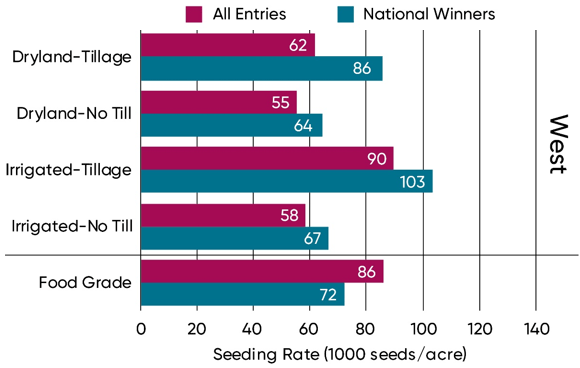
Figure 3. Average seeding rate of NSP Yield Contest national winners and all contest entries in each division in 2019.
Row Spacing
- The most common row width used in the NSP Yield Contest was 30-inch rows, which was used in 55% of contest entries (Figure 4).
- 15-inch rows was the second most popular row width, accounting for 18% of entries.
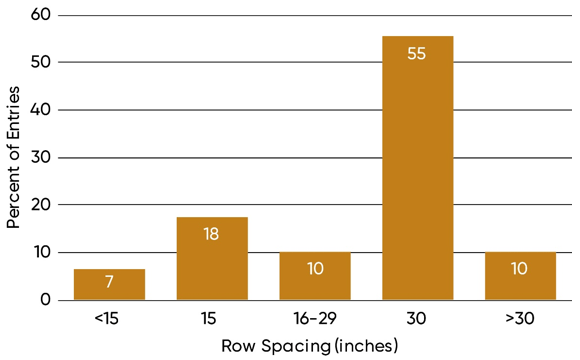
Figure 4. Row spacings used in NSP Yield Contest entries in 2019.
Nitrogen Fertilizer
- Although sorghum is considered a relatively low-input crop compared to corn, nitrogen is the nutrient that most frequently limits sorghum production.
- Sorghum requires approximately 1.1-1.5 lbs of nitrogen per bushel harvested, so a total nitrogen needed for the soil per acre can depend on expected yield.
- Only a portion of this amount needs to be supplied through nitrogen fertilizer; N is also supplied by the soil through mineralization of soil organic matter.
- The most common nitrogen fertilizer rates among 2019 NSP Yield Contest entries ranged from 101-150 lbs/acre (Figure 5).
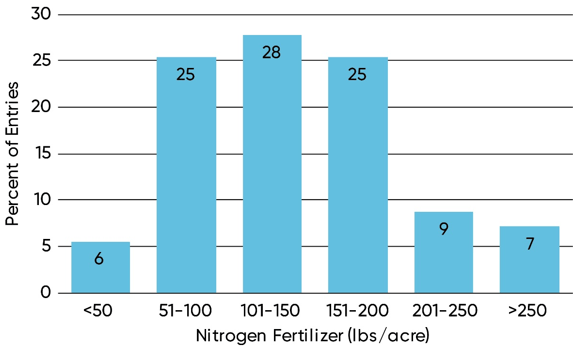
Figure 5. Nitrogen fertilizer application rates used in NSP Yield Contest entries in 2019.
The foregoing is provided for informational use only. Please contact your Pioneer sales professional for information and suggestions specific to your operation. Product performance is variable and depends on many factors such as moisture and heat stress, soil type, management practices and environmental stress as well as disease and pest pressures. Individual results may vary. Pioneer® brand products are provided subject to the terms and conditions of purchase which are part of the labeling and purchase documents.
Author: Mark Jeschke
February 2020