
Country Selector
Please enter a valid location
Fall vs. Spring Strip-Till in Indiana
Agronomy Research Update
Written by Lauren E. Schwarck and Dr. Tony J. Vyn, Agronomy Department, Purdue University
Key Findings
- A five site-year field-scale experiment compared corn growth and yield between fall and spring strip-tillage.
- Whole-plant biomass at the V6 development stage was greater with fall strip-till in four out of five site years.
- Strip-till timing had little impact on corn yield, with fall strip-till slightly outyielding spring strip-till in only one of the five site years.
- Fall vs. Spring Strip-Till
- Purdue University Research
- Study Description
- Results
- Discussion
- Video - Recommendations for Planting into Cover Crops
- References
Fall vs. Spring Strip-Till
- Whether to strip-till in the fall or the spring is an important consideration for farmers using strip-till systems, and the best approach for a given farm can depend on a number of factors, including the type of strip till machine being used, the texture and erodibility of the soil, nutrients being applied and labor availability.
- Fall strip till can help avoid wet soil conditions more common in the spring and allow the tilled soil to mellow over the winter, but it can increase the risk of erosion in the strips during the winter and spring.
- Spring strip-till can provide a freshly aerated seedbed at planting and reduces soil erosion risk but can create clods and poor seed to soil contact if soils are wetter than ideal.
Purdue University Research
- A five site-year field-scale experiment was conducted at the Agronomy Center for Research and Education (ACRE Farm) near West Lafayette, IN and Pinney Purdue Agriculture Center (PPAC Farm) near Wanatah, IN to evaluate effects of strip-till timing on corn growth and development.
- This research was led by Dr. Tony Vyn and Lauren Schwarck of Purdue University and partially supported by the Pioneer Crop Management Research Awards (CMRA) Program.
Study Description
- Strip-tillage was done in either the spring or fall using an Environmental Tillage Systems 6-row SoilWarrior coulter-type strip-till unit.
- Potassium and boron fertilizer (Aspire®, 0-0-58-0.5B) was banded in the strips at rates of 0, 58, or 116 lbs K2O/acre, representing non-treated, half-rate, and full rate treatments, respectively.
- Soil samples were taken shortly after planting each year to measure levels of plant-available potassium.
- Whole-plant tissue samples were taken at V6 and ear leaf samples at R1 to evaluate differences in potassium concentration among treatments.
- Research at the ACRE farm alternated between two fields from 2016 to 2019; the study repeated following the soybean year with the treatment positions fixed for data collection during corn years.
- Research at the PPAC farm was conducted in one field in 2019.
Results
- Whole plant tissue samples taken at the V6 stage showed that the concentration of K was similar for all site years between the two timings (data not shown) but fall strip tillage frequently had more biomass compared to spring strip-till (Figure 1).
- Ear leaf K concentrations at R1 showed no consistent difference between fall and spring strip-till timings, with fall strip-till higher in one site year, spring strip-till higher in one site year, and no significant difference in three site years (Figure 2).
- Ear leaf K concentrations increased with Aspire™ potassium and boron fertilizer application (data not shown).
- Corn yield showed little difference between fall and spring strip-till (Figure 3), with a small but significant difference detected in only one of the five site years. Fall strip till averaged 7 bu/acre more than spring strip-till in this site year.
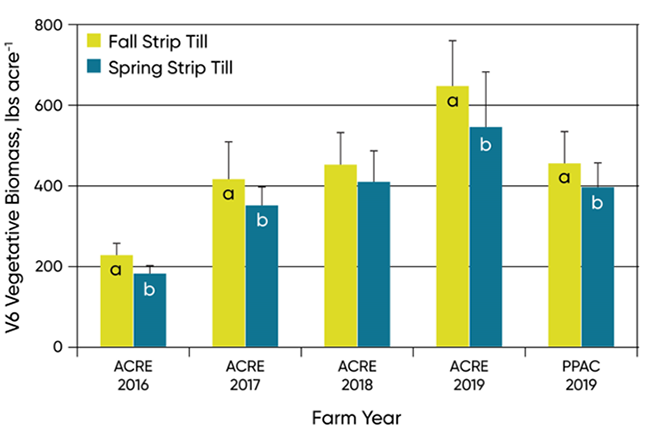
Figure 1. Aboveground plant biomass at the V6 development stage for fall and spring strip-till, averaged across all K application rates. Letters indicate a significant difference between fall and spring strip-till (p<0.05).
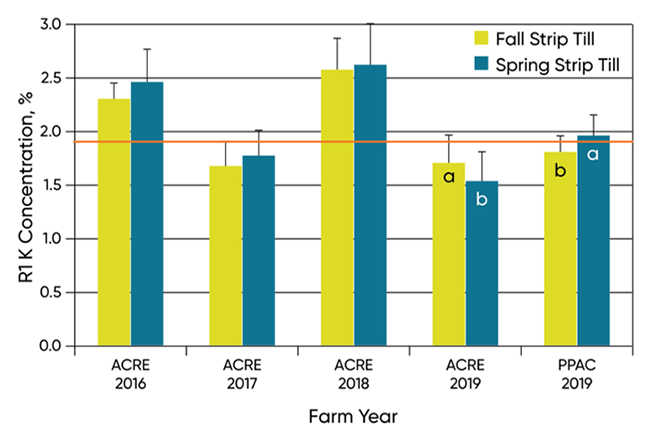
Figure 2. Ear leaf K concentration at the R1 development stage for fall and spring strip-till, averaged across all K application rates. The orange line represents the critical K concentration recommended at R1 by the Tri State Fertilizer Recommendation Guide (1.9%) (Vitosh et al., 1995). Letters indicate a significant difference between fall and spring strip-till (p<0.05).
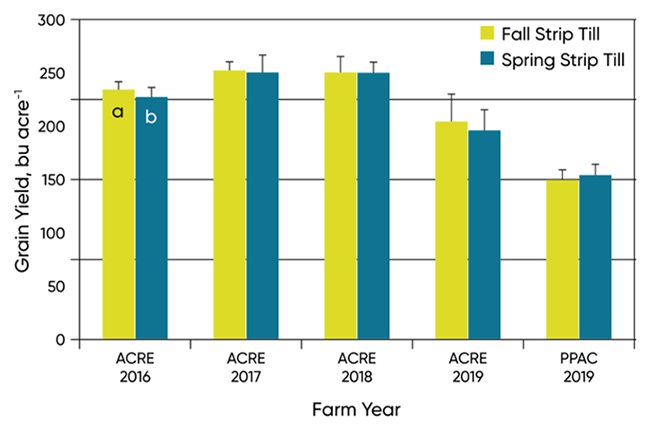
Figure 3. Corn grain yield for fall and spring strip-till, averaged across all K application rates. Letters indicate a significant difference between fall and spring strip-till (p<0.05).
Discussion
- With little difference among strip-till timings both in-season and at harvest, there was no apparent advantage to one timing over another when planting dates were the same. However, it is well known that a potential benefit with fall strip tillage is that it enables earlier planting in spring on finer-textured soils.
- An important consideration from this Purdue research (and other strip-till timing studies) is that tillage was performed in optimal conditions. Because optimal conditions were achieved in both the fall and spring, there were no plant population differences and only small growth differences due to strip-till timing.
- Whenever performing strip-till, it is essential to consider the soil condition (moisture, residue, topography, etc.). The soil surface may seem as though the soil is at the ideal moisture for tillage but digging down several inches may reveal that the soil is too wet (Figure 4). If conditions are not conducive for effective strip-till, farmers could potentially be causing damage that could limit future corn growth and development.
- Wet soil conditions during strip-till will lead to clods, causing poor seed to soil contact and smearing of sidewalls limiting root growth (Demander et al., 2013).
- Wet soil conditions are commonly prevalent in the spring, leading North Dakota specialists to generally recommend fall strip-tillage, with spring strip-tillage only advised on coarse textured soils with low organic matter (Nowatzki et al., 2017).
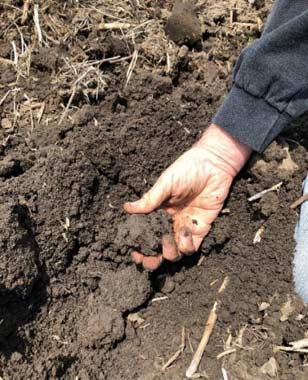
Figure 4. Excessive moisture conditions not ideal for tillage.
Video - Recommendations for Planting into Cover Crops
References
- Demander, L., S. Bossard, T. Kilcer, K. Czymmek, and Q. Ketterings. 2013. Fact Sheet 79: Zone/Strip Tillage. In Cornell University Cooperative Extension Agronomy Fact Sheet Series.
- Nowatzki, J., G. Endres, and J. Dejong-Hughes. 2017. Strip Till for Field Crop Production. North Dakota State University Extension Service and University of Minnesota Extension, June, 1-8.
- Vitosh, M.L., J.W. Johnson, and D.B. Mengel. 1995. Tri-State Fertilizer Recommendations for Corn, Soybeans, Wheat, and Alfalfa. Extension Bulletin, 2567, 1-4.
Research was supported in part by the Pioneer Crop Management Research Awards (CMRA) Program. This program provides funds for agronomic and precision farming studies by university and USDA cooperators throughout North America. The awards extend for up to four years and address crop management information needs of Pioneer agronomists, sales professionals, and customers.
The foregoing is provided for informational use only. Please contact your Pioneer sales professional for information and suggestions specific to your operation. 2016-2019 data are based on average of all comparisons made in 5 locations through Dec 1, 2019. Multi-year and multi-location is a better predictor of future performance. Do not use these or any other data from a limited number of trials as a significant factor in product selection. Product responses are variable and subject to a variety of environmental, disease, and pest pressures. Individual results may vary.